51 R shiny introduction
52 What’s a Shiny app?
52.1 Overview
An R shiny app is an interactive web application built entirely using the R programming language, allowing data scientists to create web-based dashboards and visualizations without needing expertise in HTML, CSS, or JavaScript.
It bridges R’s data analysis capabilities with the web by turning user inputs (like sliders or dropdowns) into reactive outputs (charts, tables).
A shiny app is written in a R file, using the R package shiny. The package has been created by posit and has a dedicated website : https://shiny.posit.co/
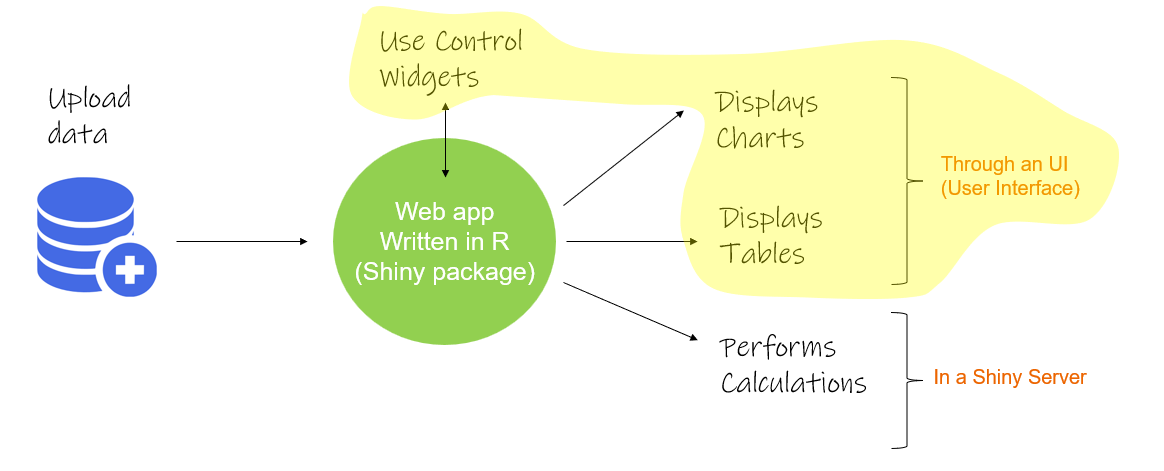
When we run this file, the app will :
import some datasets..
allow us to interact with those data.
perform some basic transformations (filtering, aggregations, mergers,…).
or more complex ones : calculations of statistical forecasts or replenishment plan for example.
display those results, through charts or tables.
A shiny app is made of 2 main parts :
an User Interface.
it contains some Control Widgets, for ex. some filters, inputs or buttons.
some charts or tables for the data visualization.
an architecture for the navigation : some panels or pages.
a Server.
- where are done all the transformations and calculations.
52.2 2 Components of a Shiny app
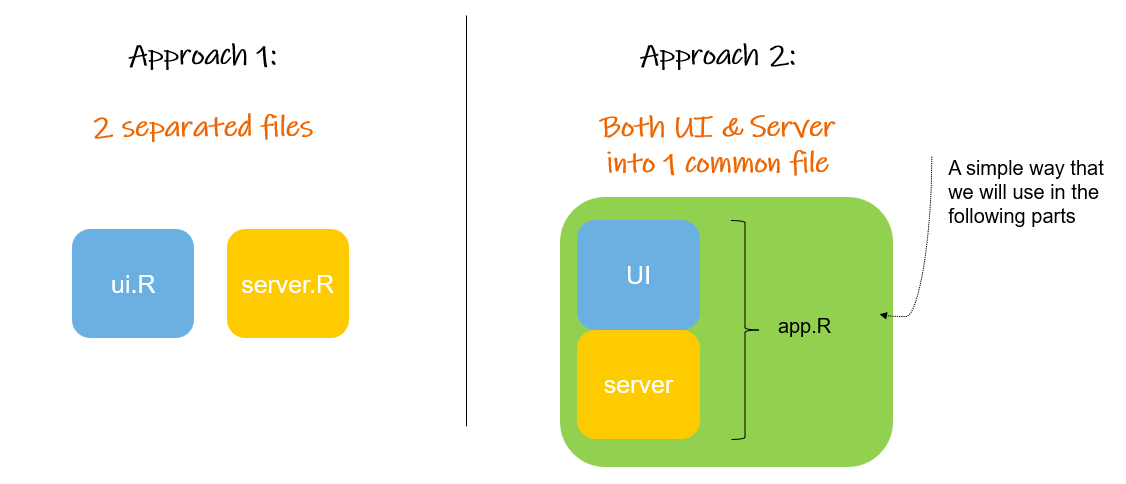
We saw just now that a shiny app has 2 components : an UI (User Interface) & a Server.
Those 2 components can be:
stored into 2 separate R files : ui.R and server.R .
or into the same, single R file.
52.3 A quick & simple architecture
To keep this introduction simple, we will use a single R file, combining both ui and server.
This approach has pros and cons :
Pros: the whole code is stored into one file.
Cons: the code can become be a bit long, as we have several lines of codes which are related to both the UI and Server into the same file.
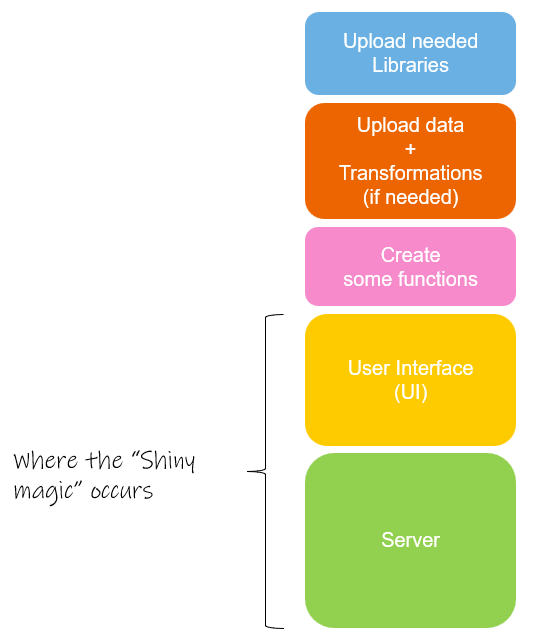
This R file will contains 5 blocks (or parts) :
Part 1 : like with any quarto file, we will upload the R libraries that we need to run the app.
Part 2 : we will upload the datasets that we aim to use, with some eventual transformations.
Part 3 : we can create some functions (or upload some, which are stored into another R file).
Part 4 : the design of the User Interface (UI).
Part 5 : the set up of the Server, with all the data transformations, calculations, and objects that we aim to display inside the User Interface.
52.4 Advices
Speed & Design (simple code) matter
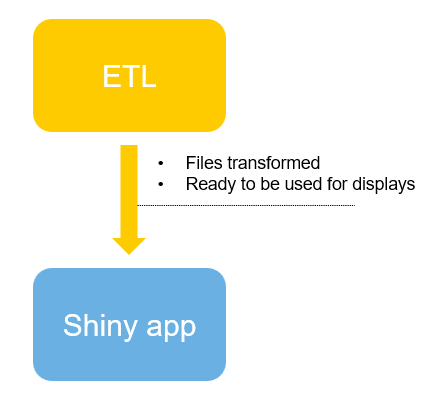
push as much calculation as possible into the background of the app, before uploading the dataset into the shiny app.
if you have some raw data to be processed and just need to look and interact with the output, it’s good to perform the ETL outside the shiny app.
let’s perform only some light, quick, data wrangling on the uploaded data in the shiny app.
keep the uploaded files to the essential (variables and observations), so only the needed data are loaded, improving the speed.
keep the shiny app for displays, navigation and specific calculations.
Remember to put MANY Comments
as much as you feel you need.
when you will look at your script in 3 or 6 months from now, it will make your understanding, debugging and improvement of the code easier.
53 Widgets & Icons
Shiny has many ways to customize our app. For example the widgets we use in our User Interface and the icons we display to make the navigation more intuitive.
Let’s have a look at a few of them.
53.1 Basic widgets
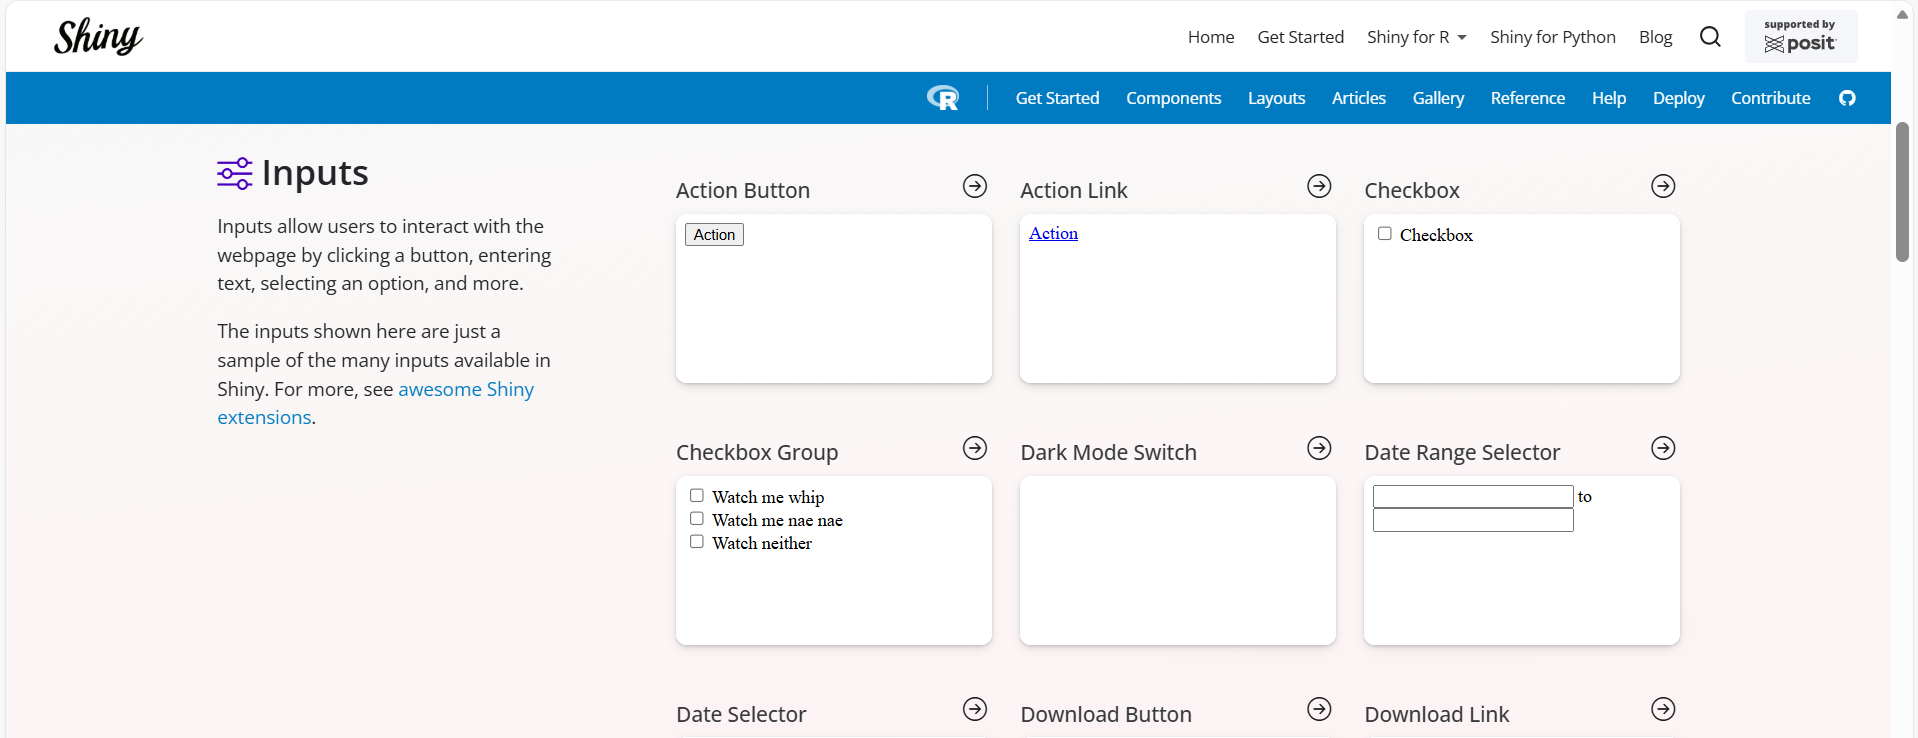
Shiny comes with some built-in widgets, very well presented on the page of the posit website :
53.2 ShinyWidgets
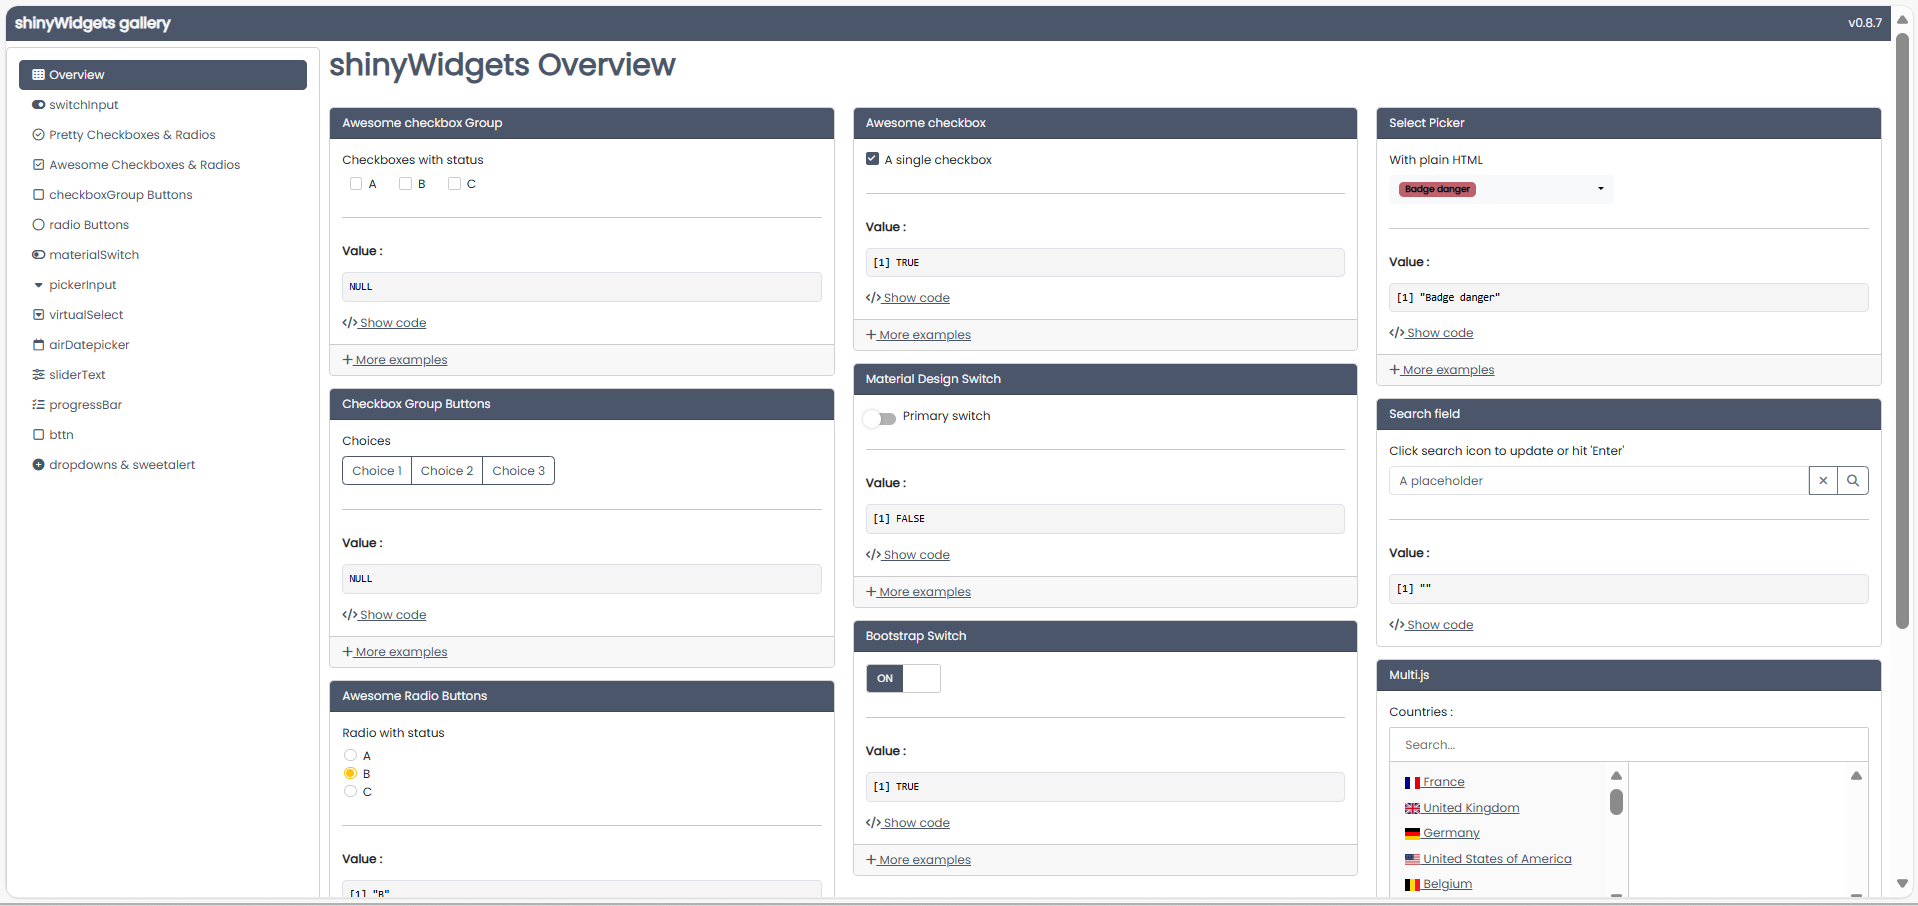
shinyWidgets is a package created by the company DreamRs : https://dreamrs.github.io/shinyWidgets/
This package provides custom widgets and other components to enhance your shiny applications.
You can replace classical checkboxes with switch button, add colors to radio buttons and checkbox group, or use buttons as radio or checkboxes.
Each widget has an update method to change the value of an input from the server.
A gallery application is included in the package where we can view the code of each widget.
Once installed, use the following command to launch it: shinyWidgets::shinyWidgetsGallery()
53.3 Fontawesome
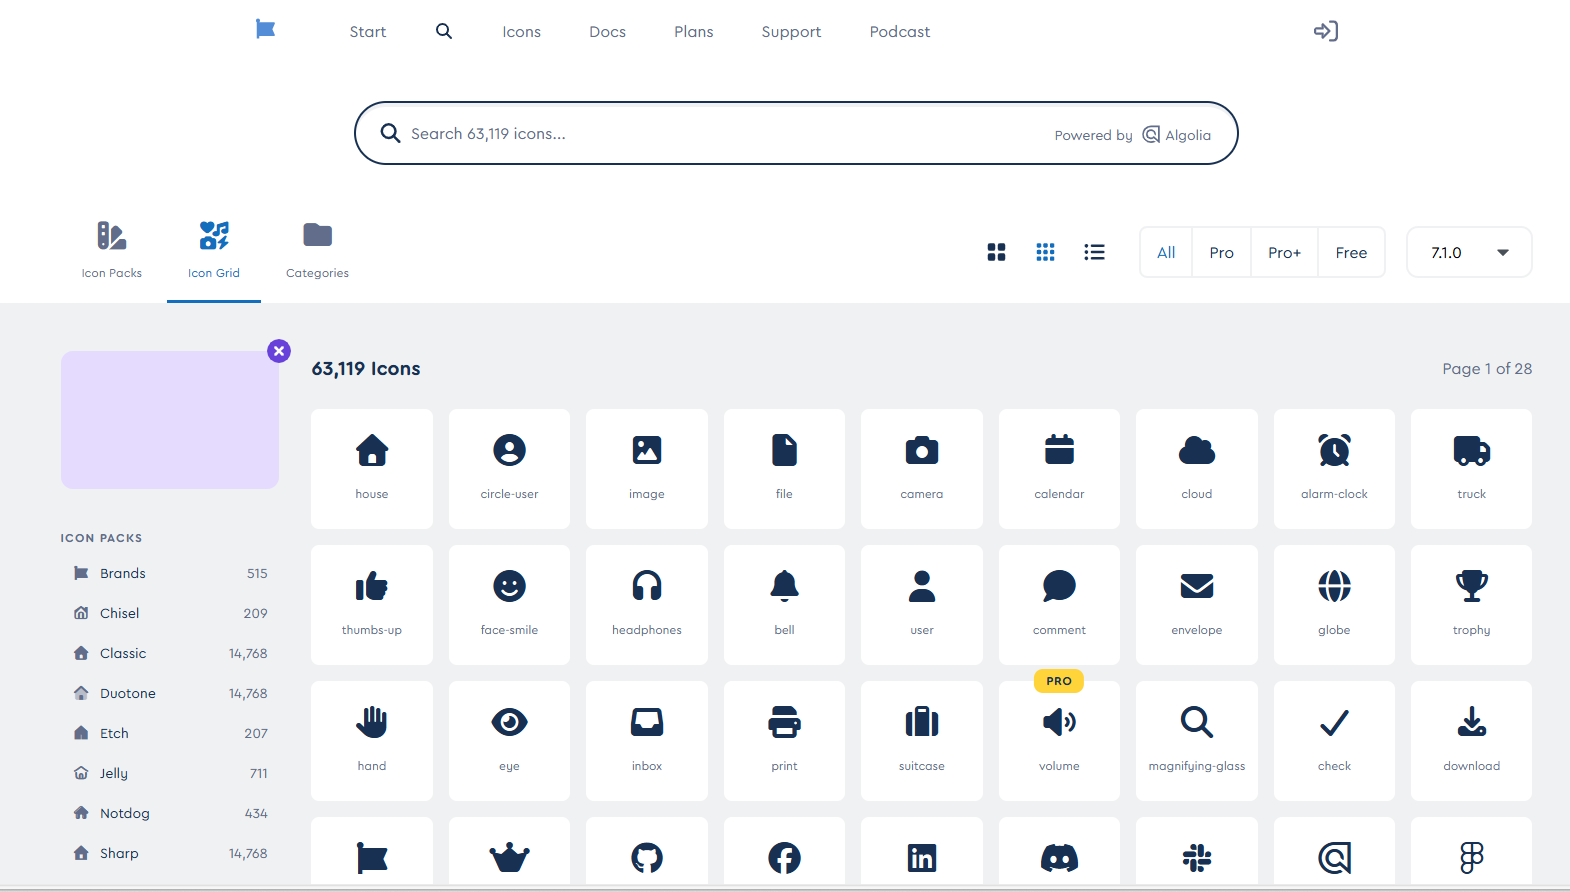
We also can put several icons in our app, on different part of the User Interface (navigation tabs, charts, tables,…).
To find all (almost!) the icons we need, to make your layouts more attractive and the navigation more intuitive, we can use the website fontawesome : https://fontawesome.com/icons?d=gallery
54 A step by step intro to shiny
This book aims to give an introduction to shiny.
We will proceed in 4 parts, and will learn gradually how to create shiny apps :
in the first part, we will see how to create a very simple shiny app.
displaying a minimalist app.
then working on the architecture :
upload and display raw data.
use filters.
add notes, break and lines.
add tabpanels.
transform data and display tables and charts.
in the second part we will :
make a focus on the reactive objects.
show how to use modules.
introduce the library
bslib.
in the third part we will practice on some examples :
creation of an app to calculate a DRP.
creation of an app using a write-back table.
Ready? Let’s start!