In this section, we’re going to use the R packagerhandsontable to:
display in the UI a table for the user to capture and modify some values.
use those new values to update some objects.
This is a feature to have an editable table , which is also commonly called “write back table”.
We saw before that shiny allows us to visualize data and run some interactive calculations.
In the first part, we will show that we also can input directly in shiny some values, then perform some calculations based on those new values, and finally update the related displays.
Then, in the last part, we will see how to download the results, using a download button.
This simple example aims to present a methodology to use shiny to run some simulations, save the outputs as a data frame, and download it.
Get demo dataset
Let’s create a simple demo data frame : an awesome team of 5 persons with each having a certain number of bottles.
The idea will be to change those numbers of bottles and visualize the updated charts in shiny.
  person bottles
1  April      10
2  Grace      20
3   Moni      30
4  Amber      40
5   Nico      50
57 Simple shiny app
Let’s create a simple shiny app as follow :
we create an initial data frame called “team_data”.
UI :
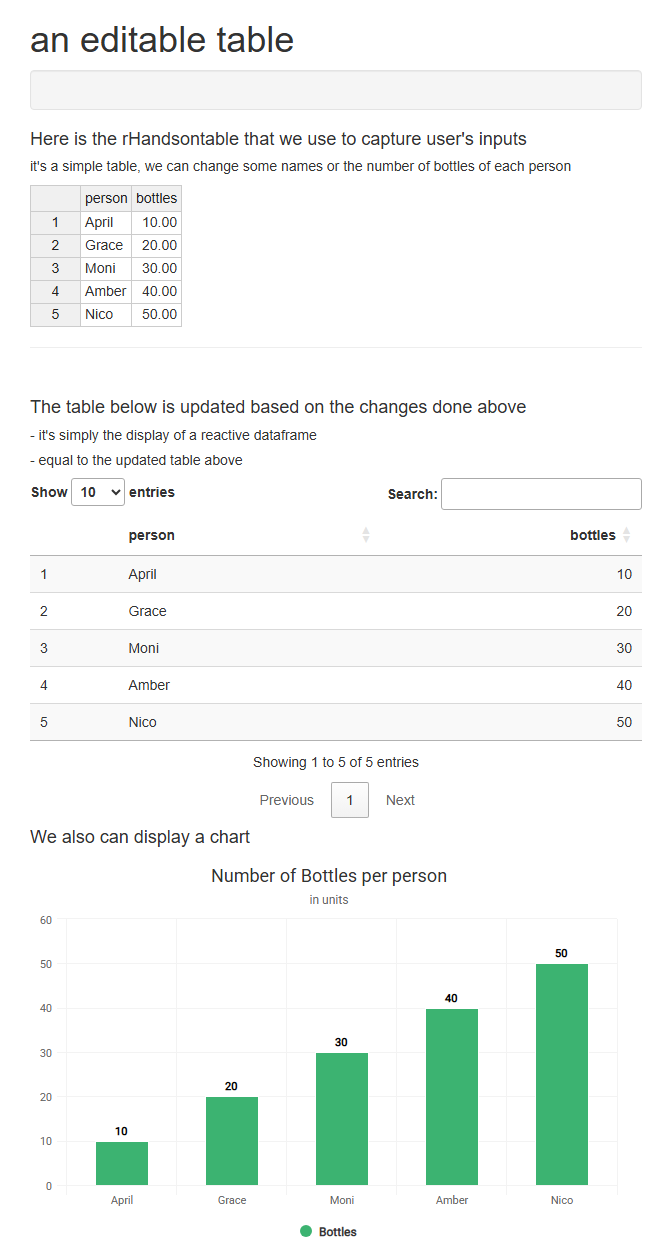
display of a rHandsontable for the user to change the number of bottles of each person.
display of those updated values in 2 outputs : a table and a chart.
server :
2 steps :
1st step : creation of an object “hot” for the user to input or modify data.
2nd step : create a reactive object “react_new_values_data”.
to keep those updated data.
and then to use this new data frame.
create objects, to display the visuals in the UI.
a DT table, and display the results (the reactive object), using the library DT.
a column chart, using the library highcharter.
57.1 Input and Display
#----------------------# Upload libraries#----------------------# ETLlibrary(tidyverse)# shinylibrary(shiny)# Tablelibrary(rhandsontable)library(DT)# Chartlibrary(highcharter)#----------------------# Create dataset#----------------------# create vectorsperson <-c("April", "Grace", "Moni", "Amber", "Nico")bottles <-c(10, 20, 30, 40, 50)# create data frameteam_data <-data.frame(person, bottles)#----------------------# UI#----------------------ui <-fluidPage(headerPanel("an editable table"), # title of the appsidebarPanel(), # close sidebarPanelmainPanel(h4("Here is the rHandsontable that we use to capture user's inputs"),h5("it's a simple table, we can change some names or the number of bottles of each person"),rHandsontableOutput("hot"),hr(),br(),fluidRow(column(6,h4("The table below is updated based on the changes done above"),h5("- it's simply the display of a reactive dataframe"),h5("- equal to the updated table above"),DTOutput("react_new_values_DT"), ),column(6,h4("We also can display a chart"),highchartOutput("react_new_values_HC") ) ) # close fluidRow ) # close mainPanel) # close ui#----------------------# Server#----------------------server <-function(input, output) {#----------------------# 1st step# Display RHandsontable# For the user to input | modify data#---------------------- output$hot <-renderRHandsontable({#-----------------# Get data df1 <- team_data#-----------------# Tablerhandsontable(df1) })#----------------------# 2nd step# Create reactive# to use the new complete dataset#---------------------- react_new_values_data <-reactive({#-----------------# Get new data df1 <-hot_to_r(input$hot) df1 <-as.data.frame(df1)#-----------------# Get Resultsreturn(df1) })#------------------------------------------------------# 3rd step# Display reactive dataset#------------------------------------------------------ output$react_new_values_DT <-renderDT({ df1 <-react_new_values_data() df1 <-as.data.frame(df1)datatable(df1) })#------------------------------------------------------# Chart 1# Based on reactive dataset#------------------------------------------------------ output$react_new_values_HC <-renderHighchart({#-----------------# Get data df1 <-react_new_values_data() df1 <-as.data.frame(df1)#-----------------# Charthighchart() |>hc_title(text ="Number of Bottles per person") |>hc_subtitle(text ="in units") |>hc_add_theme(hc_theme_google()) |>hc_xAxis(categories = df1$person) |>hc_add_series(name ="Bottles", color ="mediumseagreen",dataLabels =list(align ="center", enabled =TRUE),data = df1$bottles) |>hc_chart(type ="column") })} # close servershinyApp(ui = ui, server = server)
57.2 Download Results
The previous app allows us to capture some new inputs and use them to update other objects.
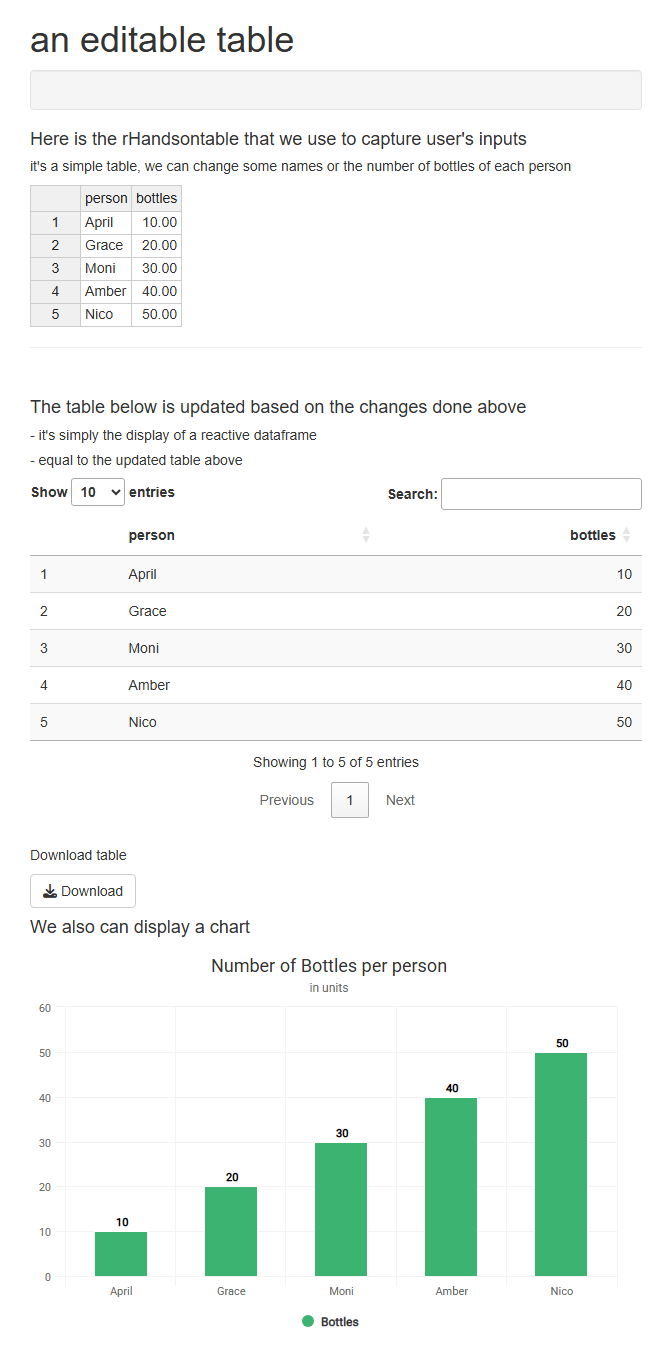
Now, let’s add a feature to download the results : a download button.
This download button will consider the reactive data frame and when we click on it, it will be downloaded as an excel file.
For this we will use the librarywritexl.
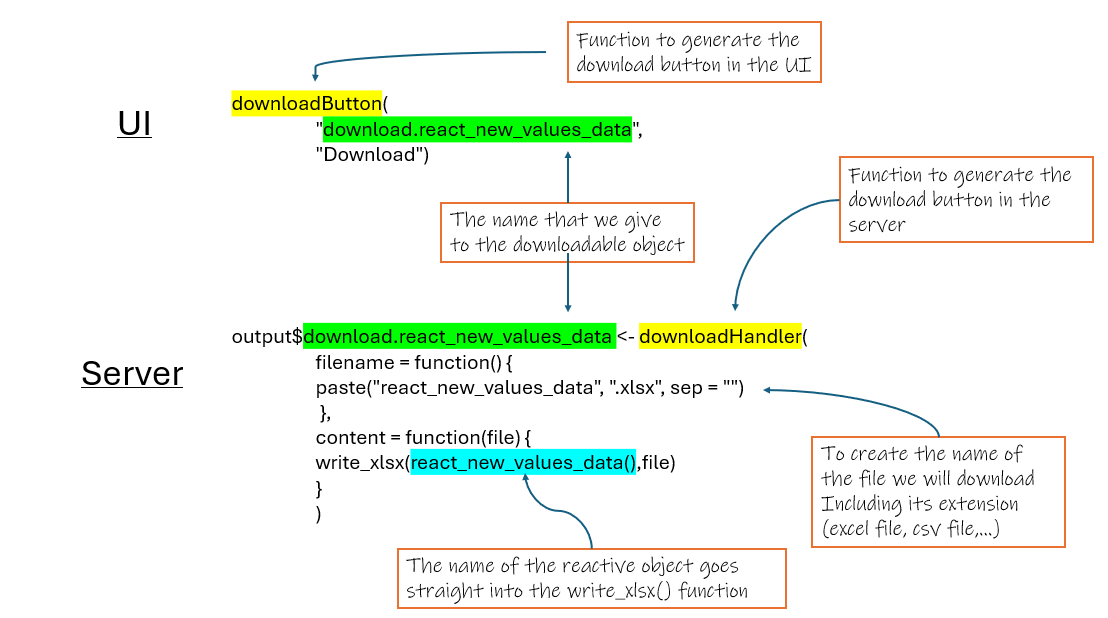
Here is how a download button works in the UI and server parts :
Figure 90 : how a download button works
Now, let’s create our new shiny app, adding those 2 parts in the UI and Server.
#----------------------# Upload libraries#----------------------# ETLlibrary(tidyverse)# shinylibrary(shiny)# Tablelibrary(rhandsontable)library(DT)library(writexl)# Chartlibrary(highcharter)#----------------------# Create dataset#----------------------person <-c("April", "Grace", "Moni", "Amber", "Nico")bottles <-c(10, 20, 30, 40, 50)team_data <-data.frame(person, bottles)#----------------------# UI#----------------------ui <-fluidPage(headerPanel("an editable table"), # title of the appsidebarPanel(), # close sidebarPanelmainPanel(h4("Here is the rHandsontable that we use to capture user's inputs"),h5("it's a simple table, we can change some names or the number of bottles of each person"),rHandsontableOutput("hot"),hr(),br(),fluidRow(column(6,h4("The table below is updated based on the changes done above"),h5("- it's simply the display of a reactive dataframe"),h5("- equal to the updated table above"),DTOutput("react_new_values_DT"),br(),h5("Download table"),downloadButton("download.react_new_values_data", "Download") ),column(6,h4("We also can display a chart"),highchartOutput("react_new_values_HC") ) ) # close fluidRow ) # close mainPanel) # close ui#----------------------# Server#----------------------server <-function(input, output) {#----------------------# 1st step# Display RHandsontable# For the user to input | modify data#---------------------- output$hot <-renderRHandsontable({#-----------------# Get data df1 <- team_data#-----------------# Tablerhandsontable(df1) })#----------------------# 2nd step# Create reactive# to use the new complete dataset#---------------------- react_new_values_data <-reactive({#-----------------# Get new data df1 <-hot_to_r(input$hot) df1 <-as.data.frame(df1)#-----------------# Get Resultsreturn(df1) })#------------------------------------------------------# 3rd step# Display reactive dataset#------------------------------------------------------ output$react_new_values_DT <-renderDT({ df1 <-react_new_values_data() df1 <-as.data.frame(df1)datatable(df1) })#------------------------------------------------------# Button 1# Download Calculated file# For react_new_values_data#------------------------------------------------------# Download selected dataset ---- output$download.react_new_values_data <-downloadHandler(filename =function() {paste("react_new_values_data", ".xlsx", sep ="") },content =function(file) {write_xlsx(react_new_values_data(),file) } ) #------------------------------------------------------# Chart 1# Based on reactive dataset#------------------------------------------------------ output$react_new_values_HC <-renderHighchart({#-----------------# Get data df1 <-react_new_values_data() df1 <-as.data.frame(df1)#-----------------# Charthighchart() |>hc_title(text ="Number of Bottles per person") |>hc_subtitle(text ="in units") |>hc_add_theme(hc_theme_google()) |>hc_xAxis(categories = df1$person) |>hc_add_series(name ="Bottles", color ="mediumseagreen",dataLabels =list(align ="center", enabled =TRUE),data = df1$bottles) |>hc_chart(type ="column") })} # close servershinyApp(ui = ui, server = server)
Listening on http://127.0.0.1:6103
58 Write back table and Filtering
58.1 Methodology
In our example, we’re using a very small dataset, and don’t really need to perform any filter.
However, in most of the situations, our original dataset might contain hundreds of rows, and might require to be filtered through different dimensions.
The issue with the previous example is that, if we filter the data, change some values on the filtered data frame and then select a new value in the filter, then the changes are not saved.
So, we will now see how to use a filter in the UI and :
update some values on the filtered data frame.
add those updated values to the original dataset.
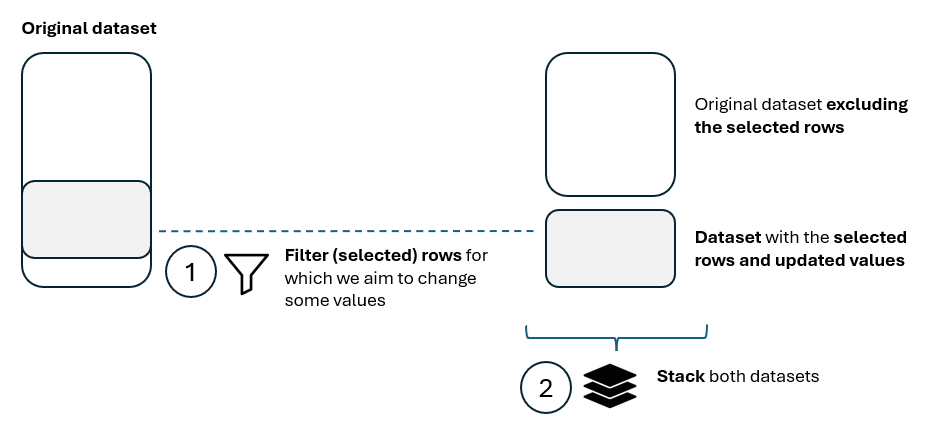
The methodology is illustrated in the picture below :
Figure 91 : create new data frame with new filtered and updated values
We also need to add a few intermediary steps, in order to combine the previous values and the new ones :
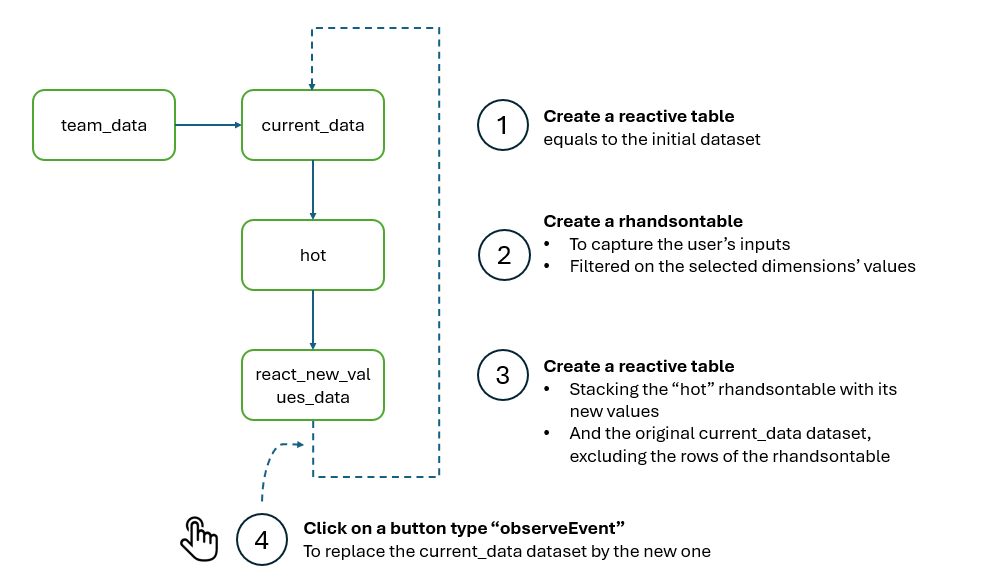
creation of a reactive table at the beginning, equals to the initial dataset.
then this reactive table will be used for the rHandsontable, to capture the new values on the selected rows.
the new data frame will then be combined with the initial one (excluding the selected rows).
and in order to save those changes, we will introduce a button type “observeEvent”.
once clicked, the new created data frame will replace the previous reactive table at the beginning.
The architecture is displayed in the picture below.
Figure 92 : architecture to keep previous and new values
58.2 shiny app
Let’s add a filter type pickerInput(), using the R packageshinyWidgets.
This filter will be used to slice the rHansontable in the second step of the Figure 88 (create new data frame with new filtered and updated values).
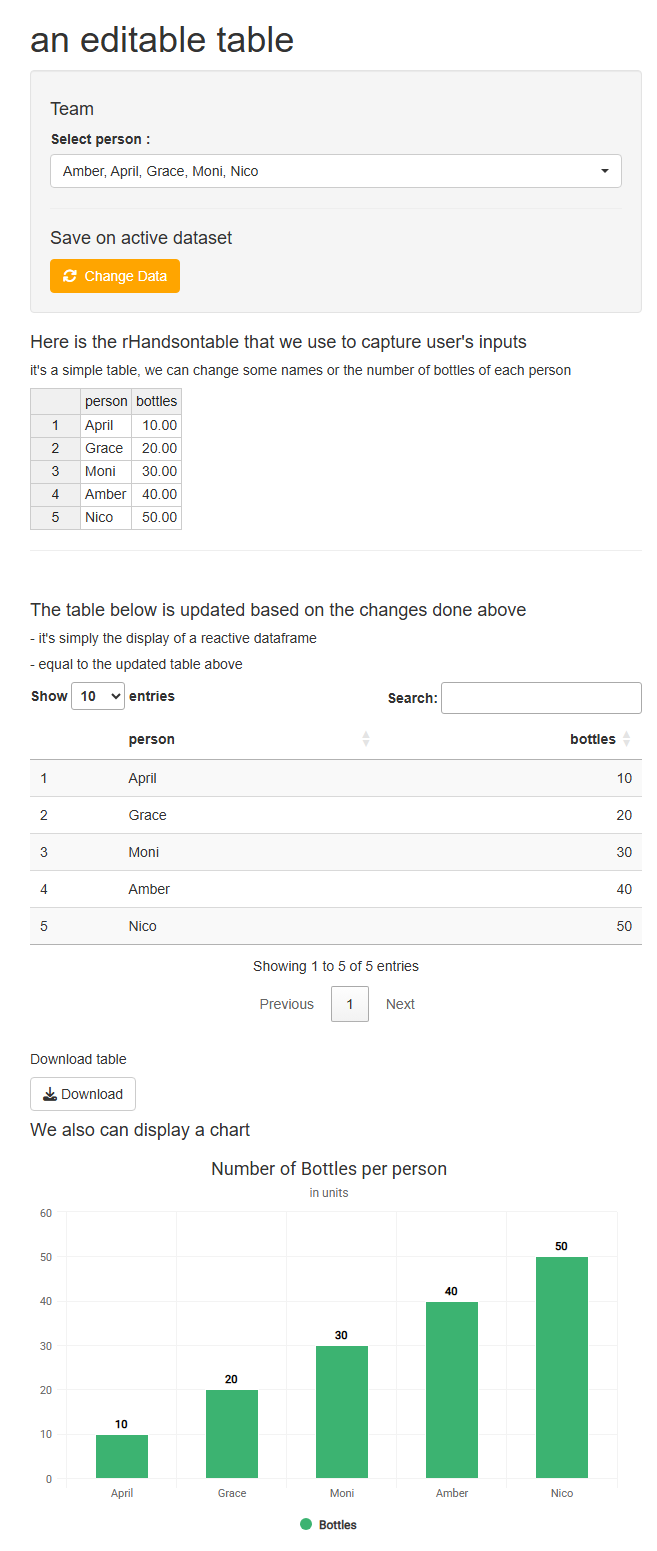
In this example :
we can :
filter the persons we want to display.
change some value in the rHandsontable.
then we click on the button “Change Data” to save those changes.
those changes, done on the filtered data frameare then added to the ones in the initial data frame, replacing the old values of the filtered selection.
#----------------------# Upload libraries#----------------------# ETLlibrary(tidyverse)# shinylibrary(shiny)library(shinyWidgets)# Tablelibrary(rhandsontable)library(DT)library(writexl)# Chartlibrary(highcharter)#----------------------# Create dataset#----------------------# create vectorsperson <-c("April", "Grace", "Moni", "Amber", "Nico")bottles <-c(10, 20, 30, 40, 50)# create data frameteam_data <-data.frame(person, bottles)#----------------------# UI#----------------------ui <-fluidPage(headerPanel("an editable table"), # title of the appsidebarPanel(h4("Team"),pickerInput("Selected.person","Select person :",choices =sort(unique(as.character(team_data$person)),decreasing =FALSE),options =list(`actions-box`=TRUE,`live-search`=TRUE),multiple = T,selected =unique(as.character(team_data$person))[1:100] ),hr(),# Button to change datah4("Save on active dataset"), tags$head( tags$style(HTML(".custom-button { color: white; background-color: orange; border-color: orange; }")) ),actionButton("change_data", "Change Data",icon =icon("refresh"), class ="custom-button") ), # close sidebarPanelmainPanel(h4("Here is the rHandsontable that we use to capture user's inputs"),h5("it's a simple table, we can change some names or the number of bottles of each person"),rHandsontableOutput("hot"),hr(),br(),fluidRow(column(6,h4("The table below is updated based on the changes done above"),h5("- it's simply the display of a reactive dataframe"),h5("- equal to the updated table above"),DTOutput("react_new_values_DT"),br(),h5("Download table"),downloadButton("download.react_new_values_data", "Download") ),column(6,h4("We also can display a chart"),highchartOutput("react_new_values_HC") ) ) # close fluidRow ) # close mainPanel) # close ui#----------------------# Server#----------------------server <-function(input, output) {#----------------------# Create a reactive value for this dataset# Making the dataset current_data as reactive# so later on we can affect other dataset#----------------------# Reactive value to hold the current dataset current_data <-reactiveVal(team_data)#----------------------# 1st step# Display RHandsontable# For the user to input | modify data#---------------------- output$hot <-renderRHandsontable({#-----------------# Get data df1 <-current_data() df1 <-as.data.frame(df1)#-----------------# Filter# select person df1 <- df1 |>filter(person %in% input$Selected.person)#-----------------# Tablerhandsontable(df1) })#----------------------# 2nd step# Create reactive# to use the new complete dataset#---------------------- react_new_values_data <-reactive({#-----------------# Get new | updated dataset#-----------------# get new data captured_data <-hot_to_r(input$hot)# formatting captured_data <-as.data.frame(captured_data)#-----------------# Get old (other SKUs) dataset#-----------------# set a working df df1 <-current_data() df1 <-as.data.frame(df1)# filter | UNSelect person df1 <- df1 |>filter(!person %in% input$Selected.person)# keep results other_data <- df1#-----------------# Combine#-----------------# stack df1 <-rbind(captured_data, other_data)#-----------------# Get Resultsreturn(df1) })#------------------------------------------------------# Button "change_data"# To assign the react_new_values_data to the current_data dataset#------------------------------------------------------# Observe the button click to change the datasetobserveEvent(input$change_data, {current_data(react_new_values_data()) })#------------------------------------------------------# 3rd step# Display reactive dataset#------------------------------------------------------ output$react_new_values_DT <-renderDT({ df1 <-react_new_values_data() df1 <-as.data.frame(df1)datatable(df1) })#------------------------------------------------------# Button 1# Download Calculated file# For react_new_values_data#------------------------------------------------------# Download selected dataset ---- output$download.react_new_values_data <-downloadHandler(filename =function() {paste("react_new_values_data", ".xlsx", sep ="") },content =function(file) {write_xlsx(react_new_values_data(),file) } ) #------------------------------------------------------# Chart 1# Based on reactive dataset#------------------------------------------------------ output$react_new_values_HC <-renderHighchart({#-----------------# Get data df1 <-react_new_values_data() df1 <-as.data.frame(df1)#-----------------# Charthighchart() |>hc_title(text ="Number of Bottles per person") |>hc_subtitle(text ="in units") |>hc_add_theme(hc_theme_google()) |>hc_xAxis(categories = df1$person) |>hc_add_series(name ="Bottles", color ="mediumseagreen",dataLabels =list(align ="center", enabled =TRUE),data = df1$bottles) |>hc_chart(type ="column") })} # close servershinyApp(ui = ui, server = server)