# ETL
library(tidyverse)

# Charts
library(collapsibleTree)
library(ggflowchart)19 Tree and Flow charts
Let’s finish our presentation of charts by introducing 2 different types :
collapsible trees.
flow charts.
We upload first the libraries that we will use : tidyverse for the ETL and 2 new ones for the charts we will present, collapsibleTree and ggflowchart .
20 collapsibleTree
collapsibleTree is a package that creates interactive, collapsible Reingold-Tilford tree diagrams based on D3.js. It enables users to visualize hierarchical data directly from data frames by clicking to expand or collapse nodes, making it ideal for exploring complex, nested structures.
2 classic usages in Supply Chain would be to visualize :
a BOM (Bill Of Materials), through multiple levels.
a flow of products through a Distribution Network.
Here is the github page for the package : https://github.com/AdeelK93/collapsibleTree
Let’s create a simple example to illustrate it.
First, we will download a data frame with 5 variables :
4 dimensions : Factory | Regional.DC (Distribution Center) | Country.DC | Product.
1 measure : Quantity (of sales).
This data frame shows :
the Quantity sold of each product in each Country.DC .
how is supplied each Country.DC : from a Regional.DC or from a Factory .
# Upload data frame

# Define the URL of the raw CSV file
url <- "https://raw.githubusercontent.com/nguyennico/chart_practice/main/Regional_Network_data.csv"

# Read the CSV file from the URL
df1 <- read.csv(url)


df1
Factory Regional.DC Country.DC Product Quantity
1 Perth Auckland Product A 1000
2 Perth Auckland Product B 2000
3 Perth Auckland Product C 800
4 Perth Taipei Product A 3200
5 Perth Taipei Product B 1700
6 Perth Taipei Product C 1000
7 Perth Singapore Singapore Product A 400
8 Perth Singapore Singapore Product B 900
9 Perth Singapore Singapore Product C 2000
10 Perth Singapore Kuala Lumpur Product A 1300
11 Perth Singapore Kuala Lumpur Product B 2400
12 Perth Singapore Kuala Lumpur Product C 800
13 Perth Singapore Bangkok Product A 900
14 Perth Singapore Bangkok Product B 1800
15 Perth Singapore Bangkok Product C 1400Now, let’s use the function collapsibleTree() to display this data frame into a Reingold-Tilford tree diagram.
We inform 3 values :
the data frame.
the order of display of the variables : here from the Factory (on the left) to the Product (on the right).
whether we want the diagram to be collapsed (
= TRUE) or not (= FALSE).
# create chart
collapsibleTree(df1,
                c("Factory", "Regional.DC", "Country.DC", "Product"),
                collapsed = FALSE
                )
Here is the same example, collapsing the nodes . By clicking on the nodes we can expand or close them.
# create chart
collapsibleTree(df1,
                c("Factory", "Regional.DC", "Country.DC", "Product"),
                collapsed = TRUE
                )
21 ggflowchart
ggflowchart is an R package that enables users to create, customize, and plot simple, aesthetic flowcharts using the ggplot2 framework.
It requires minimal code, taking data frames with “from” and “to” columns to generate diagrams, with options for customizing colors, layout orientation, and text.
To illustrate it, let’s create a simple data frame :
only 2 variables : from and to .
the value on the left is directed to the one on the right .
# create data frame
data <- data.frame(from = c(rep("Portfolio", 4),
                                rep("Family A", 3),
                                rep("Family B", 3),
                                rep("Family C", 3),
                                rep("Family D", 3)
                                ),

                       to = c("Family A", "Family B", "Family C", "Family D",
                              "Item 1", "Item 2", "Item 3",
                              "Item 4", "Item 5", "Item 6",
                              "Item 7", "Item 8", "Item 9",
                              "Item 10", "Item 11", "Item 12"
                              )
                       )

data
from to
1 Portfolio Family A
2 Portfolio Family B
3 Portfolio Family C
4 Portfolio Family D
5 Family A Item 1
6 Family A Item 2
7 Family A Item 3
8 Family B Item 4
9 Family B Item 5
10 Family B Item 6
11 Family C Item 7
12 Family C Item 8
13 Family C Item 9
14 Family D Item 10
15 Family D Item 11
16 Family D Item 12Now let’s create a flow chart, using the function ggflowchart() .
ggflowchart(data)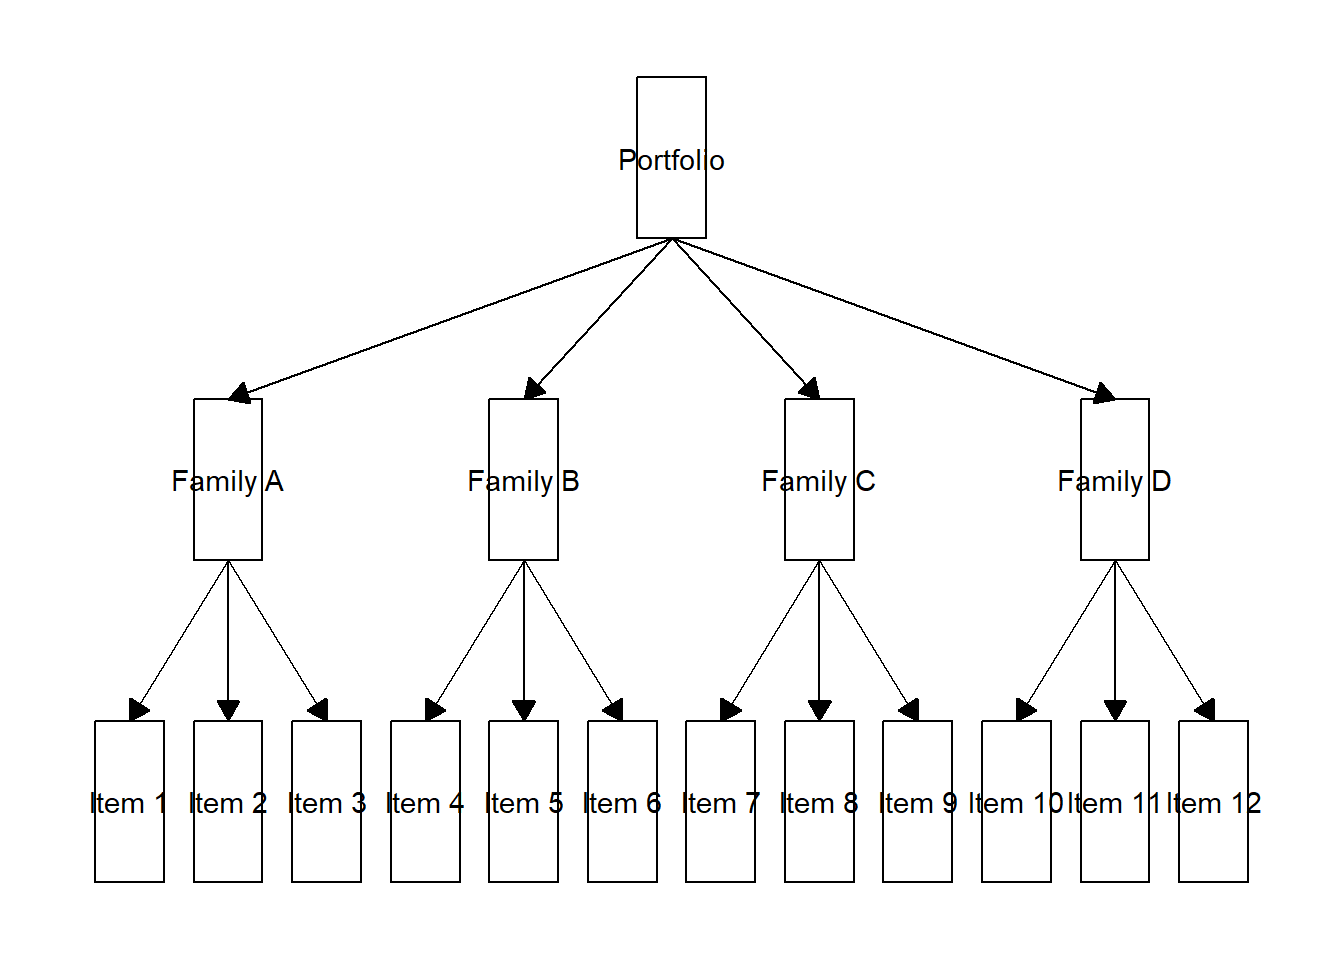
We quickly generated a flow, or to be more precised here, a hierarchy chart.
To know more about it, we can visit the website page of the author Nicola Rennie : Introducing {ggflowchart} – Nicola Rennie
The are also other related packages, for example flowchart for drawing participant flow diagrams directly from a data frame using tidyverse : https://github.com/bruigtp/flowchart