# ETL
library(tidyverse)

# shiny
library(shiny)52 A very simple shiny app
As usual, we start by uploading the libraries that we’re going to use.
53 Minimalist app
In this part, we will start by creating a minimalist shiny app. We will proceed in 5 steps :
create a simple architecture.
upload and display some data.
add a filter.
add some notes.
add some lines and breaks.
Objectives :
to present how a R shiny app works.
its 2 main parts : an UI (User Interface) and a server.
understand the reactivity concept, which is the interaction between UI and the server.
to upload, interact with data and display a simple visual result.
53.1 Simple architecture
Here we have the 2 parts of a shiny app:
an UI (User Interface).
a Server.
This code is very simple :
it only contains the basic architecture for the UI and the Server, without any particular elements inside.
both are combined into a single block of code (or a R file).
We start with the UI, then follows the Server.
The UI is generated through a fluidPage() function.
It contains here 3 parts :
a headerPanel : which contains the title of the app.
a sidebarPanel :
which will be displayed on the left side of the app.
it will contain some widgets to interact with the app, such as some filters.
a mainPanel :
where will be displayed the visuals such as tables or charts. They will be the outputs of some transformations or calculations performed in the server part.
we will see later on that the main panel can have several navigation pages or tabs.
The Server is defined by function(input, output) {}.
Later on, between the 2 {} we will create different elements :
outputs : objects to be displayed in the UI.
reactive objects : which will exist only within the server, and will be used to create other objects.
At the end of the R script, we use the function shinyApp() to combine the 2 parts (UI and Server), as follows : shinyApp(ui = ui, server = server)
Exactly like any R script, at the very beginning we will upload the libraries we need. At least here the library shiny.
We can run the chunk below to launch the shiny app.
A web page (quite empty at this moment) appears, we can see the locations of the 3 parts : headerPanel | sidebarPanel | mainPanel.
#----------------------
# Upload libraries
#----------------------

library(shiny)


#----------------------
# UI
#----------------------

ui <- fluidPage(

  headerPanel("a simple architecture"), # title of the app

  sidebarPanel(), # close sidebarPanel

  mainPanel() # close mainPanel

) # close ui


#----------------------
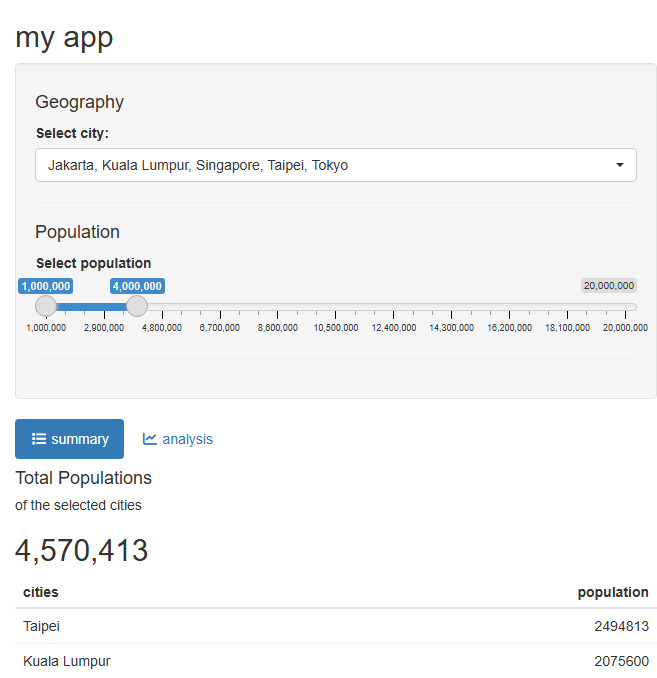
# Server
#----------------------

server <- function(input, output) {


} # close server

shinyApp(ui = ui, server = server)
Listening on http://127.0.0.1:4301
53.2 Get data
There are 2 ways to get data into a shiny app :
upload some datasets.
create some datasets.
Let’s look here at the second option, by creating a simple dataset at the beginning of the R script.
Note : when those datasets are uploaded or created outside the UI & Server parts, they are types of “universal” datasets, in the global environment. We can access them at any moment, in the UI or the Server.
#----------------------
# Upload libraries
#----------------------

library(shiny)


#----------------------
# Upload data or create datasets
#----------------------

cities <- c("Taipei", "Tokyo", "Singapore", "Kuala Lumpur", "Jakarta")

population <- c(2494813, 14254039, 6110200, 2075600, 10684946)

my_data <- data.frame(cities,
                      population)


#----------------------
# UI
#----------------------

ui <- fluidPage(

  headerPanel("a simple architecture"), # title of the app

  sidebarPanel(), # close sidebarPanel

  mainPanel() # close mainPanel

) # close ui


#----------------------
# Server
#----------------------

server <- function(input, output) {


} # close server

shinyApp(ui = ui, server = server)
Listening on http://127.0.0.1:4015
The data are loaded, but we cannot see them yet.
To visualize them, we need to create 2 things :
an output in the server part.
a display of this output in the UI part.
Let’s see how to create them.
53.3 Output creation
53.3.1 in the server
The server is where all the transformations occur.
It works pretty much the same as a chunk of code in a quarto file.
The only difference is that we :
capture this transformation between a
renderSOMETHING({xxxxx})the SOMETHING is related to the type of object we want to create (a table, a chart, a text,…).
for example the function below will render different types of objects:
renderDataTable() : a DataTable.
renderReactable() : a reactable.
renderHighchart() : a highchart chart.
renderText() : a text.
associate this created object to an output, writing
output$myobject.the transformation of calculation is performed between the 2 signs parentheses and curly bracket
({xxxxxx}).
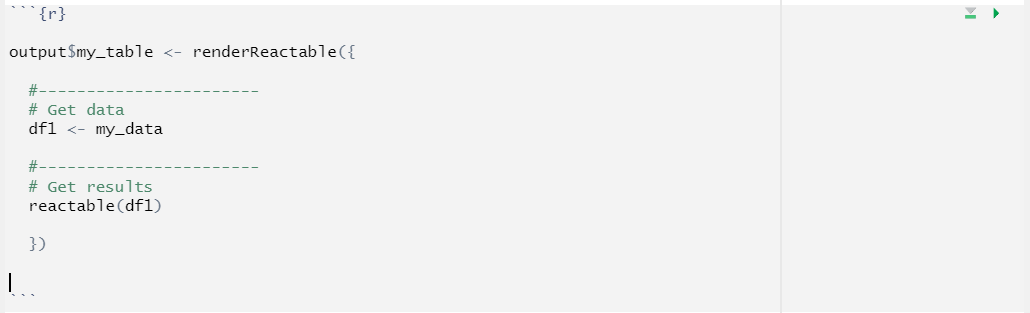
Let’s make an example where we simply want to upload the previous dataset “my_data”, and create a reactable.
We create an output called “my_table”, which is the result of : importing the dataset “my_data” and transform it into a reactable.
This part of code will be placed inside the server.
53.3.2 in the UI
Now, let’s create the display of the this output.
In the mainPanel area, we will simply write :

This function reactableOutput() is part of the package reactable, to be displayed in shiny.
53.4 all in one
Now we’re going to add into the shiny script the 2 previous parts.
A reactable appears inside the mainPanel of the UI. This table was created in the server part.
Let’s also upload more libraries at the beginning of our app : reactable, and also tidyverse.
#----------------------
# Upload libraries
#----------------------

# shiny
library(shiny)

# ETL
library(tidyverse)

# table
library(reactable)


#----------------------
# Upload data or create datasets
#----------------------

cities <- c("Taipei", "Tokyo", "Singapore", "Kuala Lumpur", "Jakarta")

population <- c(2494813, 14254039, 6110200, 2075600, 10684946)

my_data <- data.frame(cities,
                      population)


#----------------------
# UI
#----------------------

ui <- fluidPage(

  headerPanel("a simple architecture"), # title of the app

  sidebarPanel(), # close sidebarPanel

  mainPanel(

    reactableOutput("my_table")


  ) # close mainPanel

) # close ui


#----------------------
# Server
#----------------------

server <- function(input, output) {


  output$my_table <- renderReactable({

  #-----------------------
  # Get data
  df1 <- my_data

  #-----------------------
  # Get results
  reactable(df1)

  })


} # close server

shinyApp(ui = ui, server = server)
Listening on http://127.0.0.1:8800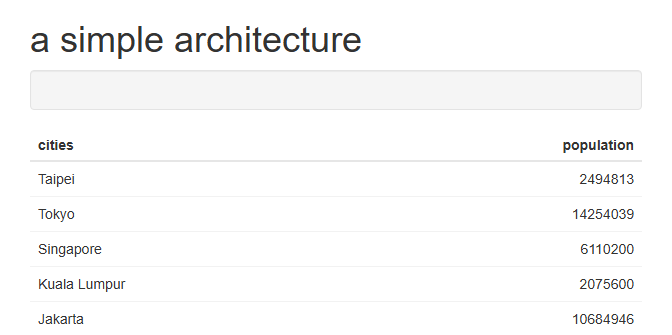
53.5 Add filter
53.5.1 create filter
Now let’s add one widget, a filter, inside the UI part.
This widget can be put anywhere, for example inside the sidebarPanel or the mainPanel.
We can use different libraries to do this, for example the widgets within the shiny package, or also the shinyWidgets package.
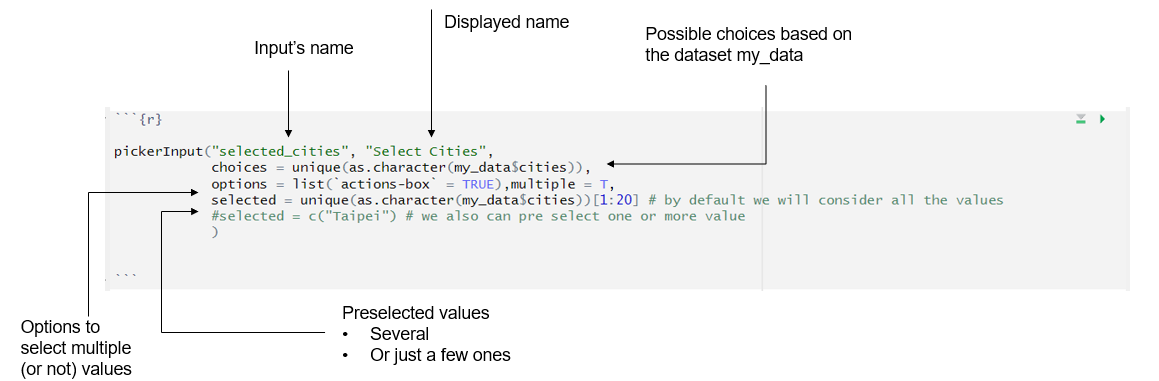
Let’s use the shinyWidgets package, and the pickerInput() function. The syntax will be as follow :
input name : “
selected_cities”. This will be the name of the filter. We will refer to it to use its values.input title : “Select Cities”. A title which will be displayed on top of the filter.
choices : the list of possible selections which will appear on the filter.
- here : the cities.
options : the
pickerInput()function has several attributes which allow us to customize its appearance.- Here we will use “
actions-box” and also allow multiple choices (withmultiple = T).
- Here we will use “
selected : we have 2 possibilities, for example to consider all the possible values, or to also preselect some.
53.5.2 add in app
Now, let’s :
add this filter into the sidebarPanel.
add a row inside the
output$my_tablewhich is in the server.this row is related to this filter, and will allow us to interact between the UI and the Server.
concretely : the selected values of the pickerInput “
selected_cities” will be used to filter the data inside the objectoutput$my_table.
Note : we also add the library shinyWidgets at the beginning of the script.
#----------------------
# Upload libraries
#----------------------

# shiny
library(shiny)
library(shinyWidgets)

# ETL
library(tidyverse)

# table
library(reactable)


#----------------------
# Upload data or create datasets
#----------------------

cities <- c("Taipei", "Tokyo", "Singapore", "Kuala Lumpur", "Jakarta")

population <- c(2494813, 14254039, 6110200, 2075600, 10684946)

my_data <- data.frame(cities,
                      population)


#----------------------
# UI
#----------------------

ui <- fluidPage(

  headerPanel("a simple architecture"), # title of the app

  sidebarPanel(

    pickerInput("selected_cities", "Select Cities",
            choices = unique(as.character(my_data$cities)),
            options = list(`actions-box` = TRUE),multiple = T,
            selected = unique(as.character(my_data$cities))[1:20] # by default we will consider all the values (i.e. all the cities)
            #selected = c("Taipei") # we also can preselect one or more value
                       )


  ), # close sidebarPanel


  mainPanel(

    reactableOutput("my_table")


  ) # close mainPanel

) # close ui


#----------------------
# Server
#----------------------

server <- function(input, output) {


  output$my_table <- renderReactable({

  #-----------------------
  # Get data
  df1 <- my_data


  #-----------------------
  # Filter

  # filter on Cities
  df1 <- df1 |> filter(cities %in% input$selected_cities)


  #-----------------------
  # Get results
  reactable(df1)

  })


} # close server

shinyApp(ui = ui, server = server)
Listening on http://127.0.0.1:4123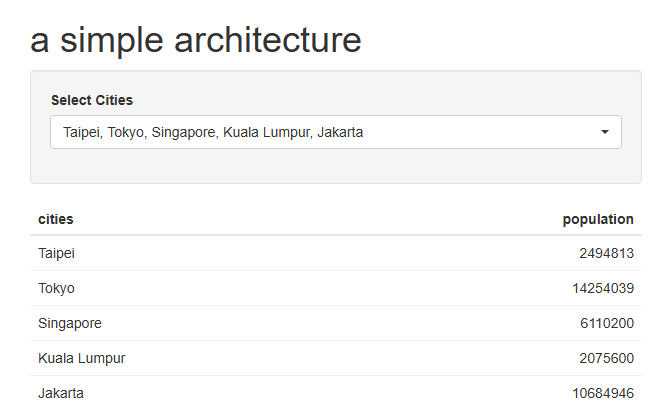
53.6 Add notes
Shiny allows us to put various notes in different areas of our app.
Those notes can come in different sizes, fonts, and colors. They also can be in different formats : bold, italic, url link.
sizes are indicated as follow :
h5("something to write"), h4(), h3(), h2(), h1().- h5 being the smallest size and h1 the biggest.
colors : to write texts in different colors, we can use the function div().
- for example :
div("This text is red!", style = "color: red").
- for example :
Let’s make one example, putting those notes into the mainPanel, above the reactable .
We will write :
“Here is our selection!”.
and in red : “Those cities are amazing!”.
#----------------------
# Upload libraries
#----------------------

# shiny
library(shiny)
library(shinyWidgets)

# ETL
library(tidyverse)

# table
library(reactable)


#----------------------
# Upload data or create datasets
#----------------------

cities <- c("Taipei", "Tokyo", "Singapore", "Kuala Lumpur", "Jakarta")

population <- c(2494813, 14254039, 6110200, 2075600, 10684946)

my_data <- data.frame(cities,
                      population)


#----------------------
# UI
#----------------------

ui <- fluidPage(

  headerPanel("a simple architecture"), # title of the app

  sidebarPanel(

    pickerInput("selected_cities", "Select Cities",
            choices = unique(as.character(my_data$cities)),
            options = list(`actions-box` = TRUE),multiple = T,
            selected = unique(as.character(my_data$cities))[1:20] # by default we will consider all the values (i.e. all the cities)
            #selected = c("Taipei") # we also can preselect one or more value
                       )


  ), # close sidebarPanel


  mainPanel(

    h3("Here is our selection!"),
    div("Those cities are amazing!", style = "color: red"),

    reactableOutput("my_table")


  ) # close mainPanel

) # close ui


#----------------------
# Server
#----------------------

server <- function(input, output) {


  output$my_table <- renderReactable({

  #-----------------------
  # Get data
  df1 <- my_data


  #-----------------------
  # Filter

  # filter on Cities
  df1 <- df1 |> filter(cities %in% input$selected_cities)


  #-----------------------
  # Get results
  reactable(df1)

  })


} # close server

shinyApp(ui = ui, server = server)
Listening on http://127.0.0.1:3328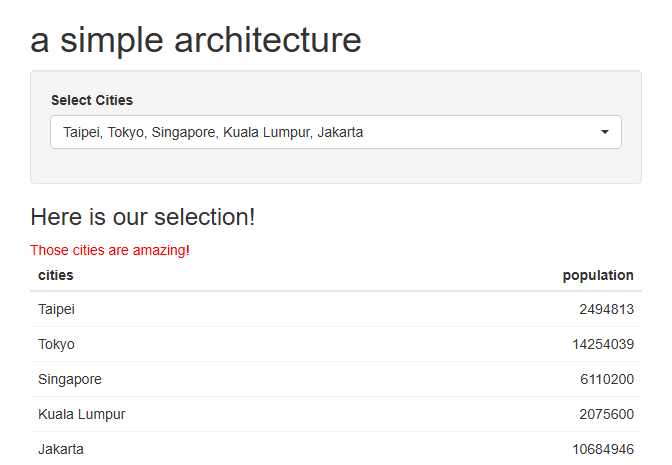
53.7 Lines and breaks
To make our app easier to read we could :
create some sections separated by an horizontal line : with the function
hr().create a break (empty line) : with the function
br().
Let’s put those 2 functions inside our mainPanel and look at the results :
#----------------------
# Upload libraries
#----------------------

# shiny
library(shiny)
library(shinyWidgets)

# ETL
library(tidyverse)

# table
library(reactable)


#----------------------
# Upload data or create datasets
#----------------------

cities <- c("Taipei", "Tokyo", "Singapore", "Kuala Lumpur", "Jakarta")

population <- c(2494813, 14254039, 6110200, 2075600, 10684946)

my_data <- data.frame(cities,
                      population)


#----------------------
# UI
#----------------------

ui <- fluidPage(

  headerPanel("a simple architecture"), # title of the app

  sidebarPanel(

    pickerInput("selected_cities", "Select Cities",
            choices = unique(as.character(my_data$cities)),
            options = list(`actions-box` = TRUE),multiple = T,
            selected = unique(as.character(my_data$cities))[1:20] # by default we will consider all the values (i.e. all the cities)
            #selected = c("Taipei") # we also can preselect one or more value
                       )


  ), # close sidebarPanel


  mainPanel(

    h3("Here is our selection!"),
    div("Those cities are amazing!", style = "color: red"),

    hr(),
    br(),

    reactableOutput("my_table")


  ) # close mainPanel

) # close ui


#----------------------
# Server
#----------------------

server <- function(input, output) {


  output$my_table <- renderReactable({

  #-----------------------
  # Get data
  df1 <- my_data


  #-----------------------
  # Filter

  # filter on Cities
  df1 <- df1 |> filter(cities %in% input$selected_cities)


  #-----------------------
  # Get results
  reactable(df1)

  })


} # close server

shinyApp(ui = ui, server = server)
Listening on http://127.0.0.1:8805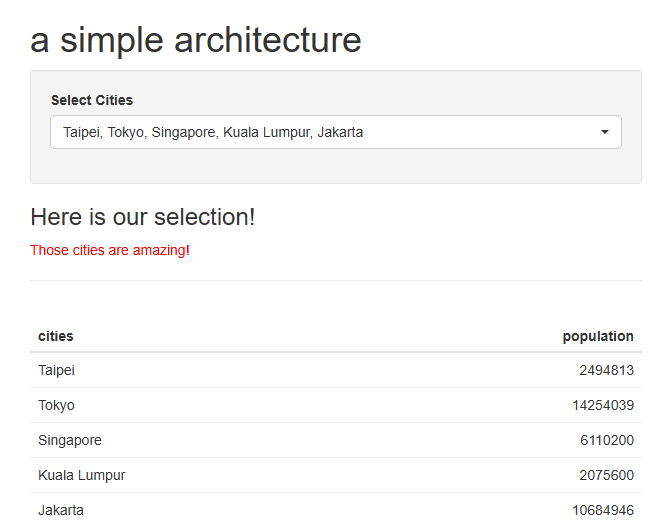
54 app layout
In this part, we are going to see, step by step, the main components and features to create the layout of a shiny app :
how to define the width of the sidebarPanel and mainPanel.
tabsetPanel and tabPanel :
- to organize the different reports or visuals we want to see inside the app.
fluidRow :
to create columns with a different width inside an area.
it allows to structure our report by placing the different elements in distinct locations.
conditional panel
- when we want to control exactly which filter can be displayed in which tabPanel.
54.1 Set width for sidebarPanel
In the previous example, the width of the sidebarPanel was a default size.
We actually can define the width we want :
the total width of a shiny app is always 12 units of measure.
we can decide to allocate :
2 units for the sidebarPanel : by writting “
width = 2” at the end of the sidebarPanel.10 units for the mainPanel : by writting “
width = 10” at the end of the mainPanel.
This way we obtain a wider mainPanel (and then a smaller sidebarPanel).
#----------------------
# Upload libraries
#----------------------

# shiny
library(shiny)


#----------------------
# Upload data or create datasets
#----------------------


#------------------------------------------------
#
#                  Shiny app
#
#------------------------------------------------


#------------------------------------------------
#
#                  SHINY UI
#
#------------------------------------------------


# Define UI  ----
ui <- fluidPage(

  # App title ----
  titlePanel("put a new title"),

  # Sidebar layout with input and output definitions ----
  sidebarLayout(

    # Sidebar panel for inputs ----
    sidebarPanel(

      h3("Place here your filters"),
      br(),
      h3("and other Control Widgets"),


      hr(),
      width = 2

    ), # end of SidebarPanel

    # Main panel for displaying outputs ----
    mainPanel(

      h2("Place some tabs here"),

      h1("and put some charts or tables"),

      width = 10

    ) # end of mainPanel
  )
)


#------------------------------------------------
#
#                  SHINY SERVER
#
#------------------------------------------------


server <- function(input, output) {


#------------------------------------------------
} # close server


#------------------------------------------------
#
#                  END of SHINY UI and SERVER
#
#------------------------------------------------


# Create Shiny app ----
shinyApp(ui, server)
Listening on http://127.0.0.1:3615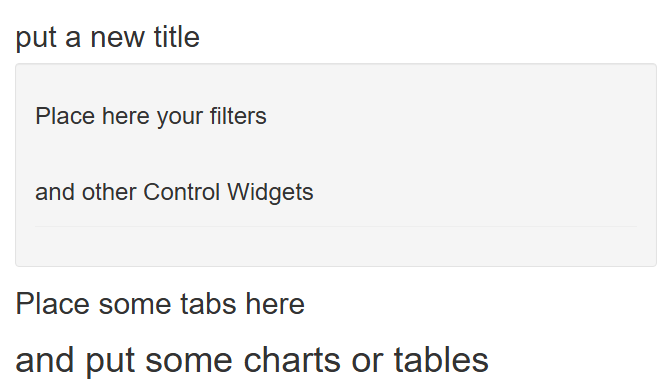
54.2 Add tabsetPanel
Inside the mainPanel, we create a tabsetPanel.
A tabsetPanel :
has a “type” : “
tabs” or “pills”, each having a particular style (type) to display the navigation between the each tabPanel.contains some tabPanel :
which are like pages, that we can select to visualize different reports.
- they help to organize our work.
to create a tabPanel, we just need to write :
tabPanel("the name we want to give to it").we also can add one icon :
tabPanel("my data", icon = icon("database").the icons could come from the website fontawesome for example.
#----------------------
# Upload libraries
#----------------------

# shiny
library(shiny)


#----------------------
# Upload data or create datasets
#----------------------


#------------------------------------------------
#
#                  Shiny app
#
#------------------------------------------------


#------------------------------------------------
#
#                  SHINY UI
#
#------------------------------------------------


# Define UI ----
ui <- fluidPage(

  # App title ----
  titlePanel("Layout with tabsetPanel"),

  # Sidebar layout with input and output definitions ----
  sidebarLayout(

    # Sidebar panel for inputs ----
    sidebarPanel(

      h4("Place here your filters"),
      br(),
      h4("and other Control Widgets"),


      hr(),
      width = 2

    ), # end of SidebarPanel

    # Main panel for displaying outputs ----
    mainPanel(

      # Output: Tabset w/ plot, summary, and table ----
      tabsetPanel(type = "tabs",

                  tabPanel("my data", icon = icon("database"),

                           h2("Let's write something here!")
                           ),

                  tabPanel("analysis", icon = icon("chart-line"),

                           h1("A chart will be here!")
                           ),

                  tabPanel("details", icon = icon("list")),

                  tabPanel("tab4", icon = icon("th")),

                  tabPanel("tab5")

      ), # close tabsetPanel

      width = 10

    ) # end of mainPanel
  )
)


#------------------------------------------------
#
#
#                  SHINY SERVER
#
#
#------------------------------------------------


server <- function(input, output) {


#------------------------------------------------
} # close server


#------------------------------------------------
#
#
#                  END of SHINY UI and SERVER
#
#
#------------------------------------------------


# Create Shiny app ----
shinyApp(ui, server)
Listening on http://127.0.0.1:5118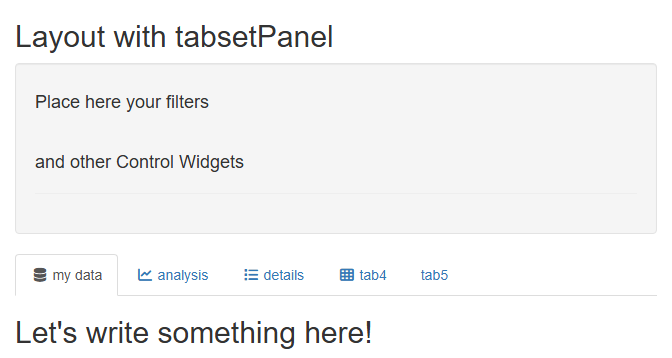
54.3 Add tabsetPanel inside a tabPanel
In this example let’s :
change the type of the tabsetPanel to “
pills”.create a tabsetPanel within the first tabPanel, and with 2 tabPanels inside.
#----------------------
# Upload libraries
#----------------------

# shiny
library(shiny)


#----------------------
# Upload data or create datasets
#----------------------


#------------------------------------------------
#
#                  Shiny app
#
#------------------------------------------------


#------------------------------------------------
#
#                  SHINY UI
#
#------------------------------------------------


# Define UI ----
ui <- fluidPage(

  # App title ----
  titlePanel("Layout with tabsetPanel"),

  # Sidebar layout with input and output definitions ----
  sidebarLayout(

    # Sidebar panel for inputs ----
    sidebarPanel(

      h4("Place here your filters"),
      br(),
      h4("and other Control Widgets"),


      hr(),
      width = 2

    ), # end of SidebarPanel

    # Main panel for displaying outputs ----
    mainPanel(

      # Output: Tabset w/ plot, summary, and table ----
      tabsetPanel(type = "pills",

                  tabPanel("my data", icon = icon("database"),

                           tabsetPanel(

                             tabPanel("a sub tab is here",

                                      h3("later we can put a table here")
                                      ),


                             tabPanel("and another one  is also here")

                           ) # close tabsetPanel

                           ),

                  tabPanel("analysis", icon = icon("chart-line")),

                  tabPanel("details", icon = icon("list")),

                  tabPanel("tab4", icon = icon("th")),

                  tabPanel("tab5")

      ), # close tabsetPanel

      width = 10

    ) # end of mainPanel
  )
)


#------------------------------------------------
#
#
#                  SHINY SERVER
#
#
#------------------------------------------------


server <- function(input, output) {


#------------------------------------------------
} # close server


#------------------------------------------------
#
#
#                  END of SHINY UI and SERVER
#
#
#------------------------------------------------


# Create Shiny app ----
shinyApp(ui, server)
Listening on http://127.0.0.1:6817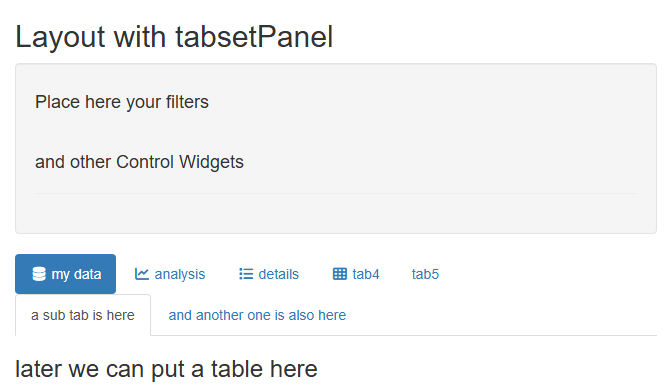
54.4 Arrange elements
54.4.1 grid layout
As we saw, in shiny an area has always by default a fixed width of 12 units of measure (UoM).
We can arrange some elements within columns of different width, for example :
we create 3 columns of different widths.
one on the left with 3 UoM, one in the center with 7 UoM, one on the right with 2 UoM.
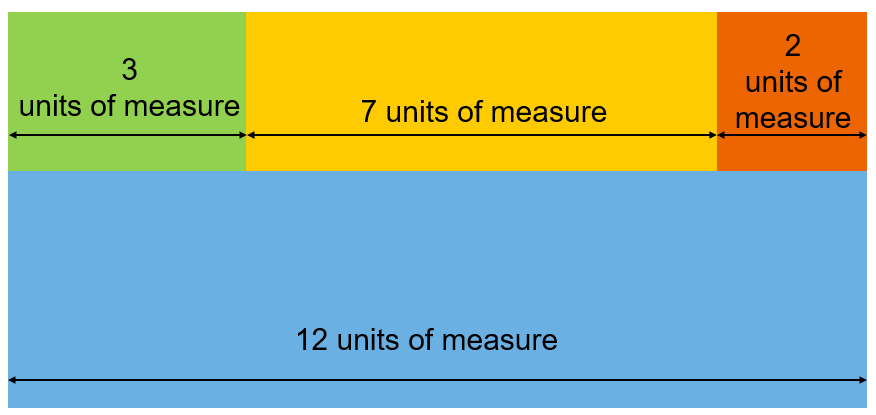
For this, we will use the function fluidRow().
It helps us to organize our work within one page, by creating sections (columns) of different widths.
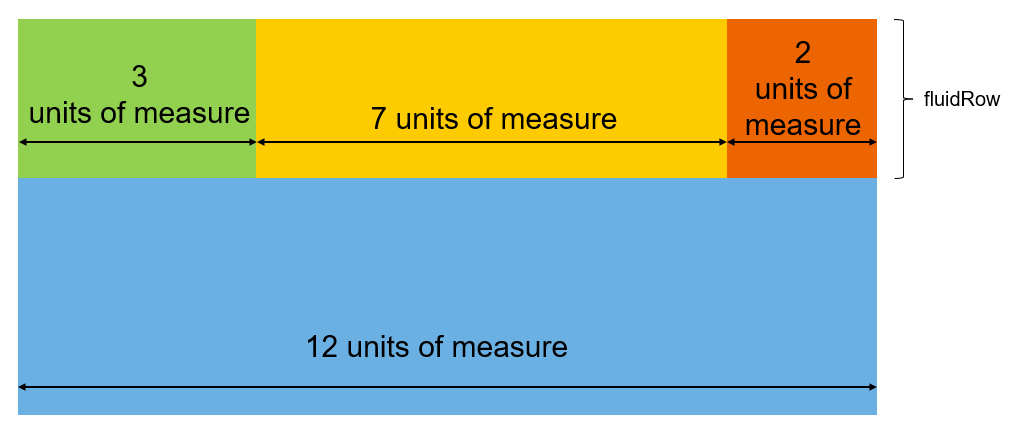
54.4.2 fluidRow
The function fluidRow() comes along with the function column() to create a column, and define its width.
For example : column(4), means that in the considered area, this column will occupy the width of 4 units of measure (UoM), among a total of 12 UoM.
The function fluidRow(), will have a certain number of columns. The sum of the width of all the columns must be equal to 12 UoM.
Here is an example, in the tabPanel “analysis”. We have 2 columns :
a large one with 8 UoM.
a small one with 4 UoM.
#----------------------
# Upload libraries
#----------------------

# shiny
library(shiny)


#----------------------
# Upload data or create datasets
#----------------------


#------------------------------------------------
#
#                  Shiny app
#
#------------------------------------------------


#------------------------------------------------
#
#                  SHINY UI
#
#------------------------------------------------


# Define UI ----
ui <- fluidPage(

  # App title ----
  titlePanel("Layout with tabsetPanel"),

  # Sidebar layout with input and output definitions ----
  sidebarLayout(

    # Sidebar panel for inputs ----
    sidebarPanel(

      h4("Place here your filters"),
      br(),
      h4("and other Control Widgets"),


      hr(),
      width = 2

    ), # end of SidebarPanel

    # Main panel for displaying outputs ----
    mainPanel(

      # Output: Tabset w/ plot, summary, and table ----
      tabsetPanel(type = "pills",

                  tabPanel("my data", icon = icon("database"),

                           tabsetPanel(

                             tabPanel("a sub tab is here",

                                      h3("later we can put a table here")
                                      ),


                             tabPanel("and another one  is also here")

                           ) # close tabsetPanel

                           ),

                  tabPanel("analysis", icon = icon("chart-line"),

                           fluidRow(

                             column(8,
                                    h2("large column"),
                                    h2("occupies 8 units of measure")
                                    ),

                             column(4,
                                    h4("smaller one"),
                                    h4("occupies 4 units of measure")
                                    )


                           )

                           ),

                  tabPanel("details", icon = icon("list")),

                  tabPanel("tab4", icon = icon("th")),

                  tabPanel("tab5")

      ), # close tabsetPanel

      width = 10

    ) # end of mainPanel
  )
)


#------------------------------------------------
#
#
#                  SHINY SERVER
#
#
#------------------------------------------------


server <- function(input, output) {


#------------------------------------------------
} # close server


#------------------------------------------------
#
#
#                  END of SHINY UI and SERVER
#
#
#------------------------------------------------


# Create Shiny app ----
shinyApp(ui, server)
Listening on http://127.0.0.1:8176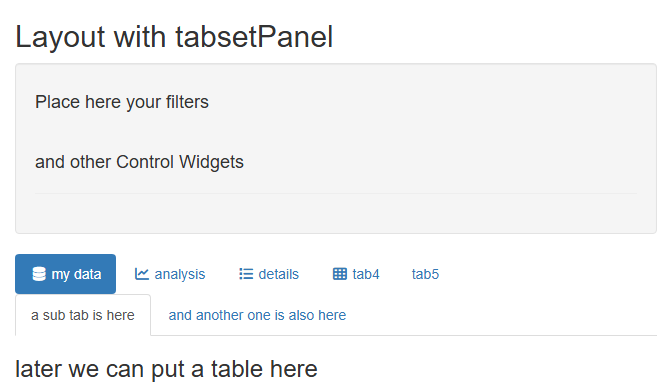
54.5 conditional panel
We have inside the sidebarPanel the different widgets (filters, sliders,…) that we need to interact with the visuals we want to display inside the mainPanel.
Sometimes, we want to display only some particular widgets related to a tabPanel. By doing so we make sure to have a clear ui, with components only related to the objects they interact with.
A conditional panel can be written within the sidebarPanel, with the following syntax :
conditionalPanel(condition = "input.tabselected == 1",
h5("here we can put the widgets we want to use") )
We notice that there is a condition, which is related to the tabPanel we selected.
This tabPanel will have an ID, let’s say the number 1 in this example. Once we select this tabPanel, the related conditionalPanel inside the sidebarPanel will appear.
To provide an ID to the tabPanel we have to :
mention the syntax
id = "tabselected"within the tabsetPanel.capture the tabPanel ID value, for example :
tabPanel("summary", icon = icon("list"), value = 1).
Let’s create a simple example :
a pickerInput from the R package
shinyWidgetsthat we want to display when the tabPanel “summary” or “analysis” are open.a slider that we want to display only when the tabPanel “summary” is open.
Note : when we want a conditionalPanel to appear on different tabPanels, we will list the tabs’ID as follow : “input.tabselected == 1 || input.tabselected == 2”.
#----------------------
# Upload libraries
#----------------------

# shiny
library(shiny)
library(shinyWidgets)


#----------------------
# Upload data or create datasets
#----------------------

cities <- c("Taipei", "Tokyo", "Singapore", "Kuala Lumpur", "Jakarta")

population <- c(2494813, 14254039, 6110200, 2075600, 10684946)

my_data <- data.frame(cities,
                      population)


#------------------------------------------------
#
#                  Shiny app
#
#------------------------------------------------


#------------------------------------------------
#
#                  SHINY UI
#
#------------------------------------------------


# Define UI ----
ui <- fluidPage(

  # App title ----
  titlePanel("my app"),

  # Sidebar layout with input and output definitions ----
  sidebarLayout(

    # Sidebar panel for inputs ----
    sidebarPanel(

      conditionalPanel(condition = "input.tabselected == 1 || input.tabselected == 2",

                       h4("Geography"),

                       pickerInput("Selected.cities","Select city:",
                                   choices = sort(unique(my_data$cities),decreasing = FALSE),
                                   options = list(`actions-box` = TRUE,`live-search`=TRUE),multiple = T,
                                   selected = unique(my_data$cities)[1:1000]
                                   #selected = c("Taipei") # if we want a preselection
                       ),

                       hr()


      ), # close conditionalPanel


      conditionalPanel(condition = "input.tabselected == 1",

                       h4("Population"),

                       sliderInput(
                         "Selected.population", "Select population",
                         min = 1000000, max = 20000000,
                         value = c(1000000, 4000000)
                       )


      ), # close conditionalPanel


      hr(),
      width = 2

    ), # end of SidebarPanel

    # Main panel for displaying outputs ----
    mainPanel(

      # Output: Tabset w/ plot, summary, and table ----
      tabsetPanel(type = "pills",

                  tabPanel("summary", icon = icon("list"), value = 1),

                  tabPanel("analysis", icon = icon("chart-line"), value = 2),


                  id = "tabselected"
                  ), # close tabsetPanel
      width = 10

    ) # end of mainPanel
  )
)


#------------------------------------------------
#
#
#                  SHINY SERVER
#
#
#------------------------------------------------


server <- function(input, output) {


#------------------------------------------------
} # close server


#------------------------------------------------
#
#
#                  END of SHINY UI and SERVER
#
#
#------------------------------------------------


# Create Shiny app ----
shinyApp(ui, server)
Listening on http://127.0.0.1:7849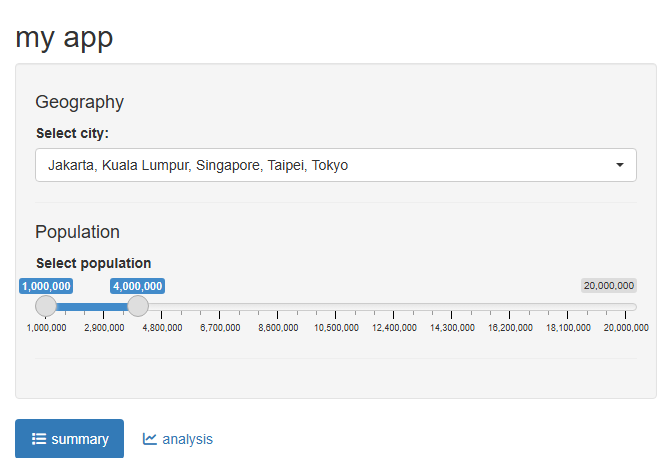
55 A complete example
Now, let’s continue on the previous example, and add 3 displays to our shiny app :
a table : using the R package
reactable.a chart : using the R package
highcharter.a text.
Those displays will interact with the widgets from the sidebarPanel, depending on the tabPanel we look at.
55.1 Table
#----------------------
# Upload libraries
#----------------------

# shiny
library(shiny)
library(shinyWidgets)

# ETL
library(tidyverse)

# table
library(reactable)

# charts
library(highcharter)
Registered S3 method overwritten by 'quantmod':
method from
as.zoo.data.frame zoo Highcharts (www.highcharts.com) is a Highsoft software product which isnot free for commercial and Governmental use#----------------------
# Upload data or create datasets
#----------------------
cities <- c("Taipei", "Tokyo", "Singapore", "Kuala Lumpur", "Jakarta")
population <- c(2494813, 14254039, 6110200, 2075600, 10684946)
my_data <- data.frame(cities,
population)
#------------------------------------------------
#
# Shiny app
#
#------------------------------------------------
#------------------------------------------------
#
# SHINY UI
#
#------------------------------------------------
# Define UI ----
ui <- fluidPage(
# App title ----
titlePanel("my app"),
# Sidebar layout with input and output definitions ----
sidebarLayout(
# Sidebar panel for inputs ----
sidebarPanel(
conditionalPanel(condition = "input.tabselected == 1 || input.tabselected == 2",
h4("Geography"),
pickerInput("Selected.cities","Select city:",
choices = sort(unique(my_data$cities),decreasing = FALSE),
options = list(`actions-box` = TRUE,`live-search`=TRUE),multiple = T,
selected = unique(my_data$cities)[1:1000]
#selected = c("Taipei") # if we want a preselection
),
hr()
), # close conditionalPanel
conditionalPanel(condition = "input.tabselected == 1",
h4("Population"),
sliderInput(
"Selected.population", "Select population",
min = 1000000, max = 20000000,
value = c(1000000, 4000000)
)
), # close conditionalPanel
hr(),
width = 2
), # end of SidebarPanel
# Main panel for displaying outputs ----
mainPanel(
# Output: Tabset w/ plot, summary, and table ----
tabsetPanel(type = "pills",
tabPanel("summary", icon = icon("list"), value = 1,
reactableOutput("summary_RT")
),
tabPanel("analysis", icon = icon("chart-line"), value = 2),
id = "tabselected"
), # close tabsetPanel
width = 10
) # end of mainPanel
)
)
#------------------------------------------------
#
#
# SHINY SERVER
#
#
#------------------------------------------------
server <- function(input, output) {
#------------------------------------------------
# Table 1
# Display of Summary table
#------------------------------------------------
output$summary_RT <- renderReactable({
#------------------
# Get data
df1 <- my_data
#------------------
# Filter
# Select city
df1 <- df1 |> filter(cities %in% input$Selected.cities)
# Select population
df1 <- df1 |> filter(population >= input$Selected.population[1] & population <= input$Selected.population[2])
#------------------
# Transform
#------------------
# Table
reactable(df1)
})
#------------------------------------------------
} # close server
#------------------------------------------------
#
#
# END of SHINY UI and SERVER
#
#
#------------------------------------------------
# Create Shiny app ----
shinyApp(ui, server)
Listening on http://127.0.0.1:3827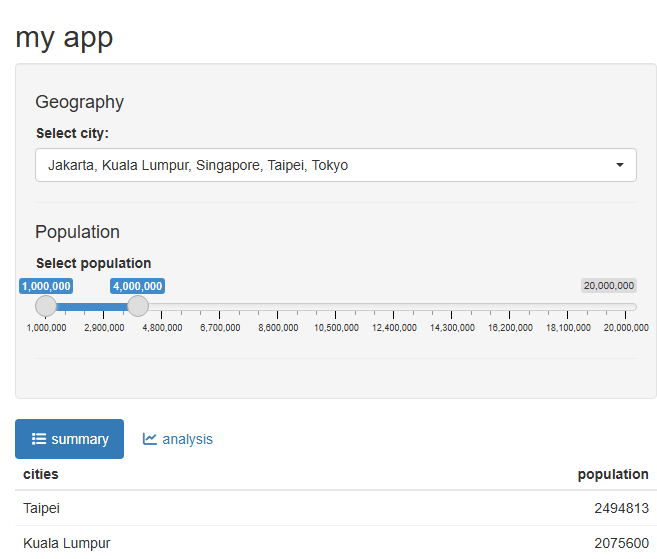
55.2 Chart
Now, let’s add a column chart, using the R package highcharter. We will display this chart inside the tabPanel “analysis”, and make it link only to the filter related to the cities.
#----------------------
# Upload libraries
#----------------------

# shiny
library(shiny)
library(shinyWidgets)

# ETL
library(tidyverse)

# table
library(reactable)

# charts
library(highcharter)


#----------------------
# Upload data or create datasets
#----------------------

cities <- c("Taipei", "Tokyo", "Singapore", "Kuala Lumpur", "Jakarta")

population <- c(2494813, 14254039, 6110200, 2075600, 10684946)

my_data <- data.frame(cities,
                      population)


#------------------------------------------------
#
#                  Shiny app
#
#------------------------------------------------


#------------------------------------------------
#
#                  SHINY UI
#
#------------------------------------------------


# Define UI ----
ui <- fluidPage(

  # App title ----
  titlePanel("my app"),

  # Sidebar layout with input and output definitions ----
  sidebarLayout(

    # Sidebar panel for inputs ----
    sidebarPanel(

      conditionalPanel(condition = "input.tabselected == 1 || input.tabselected == 2",

                       h4("Geography"),

                       pickerInput("Selected.cities","Select city:",
                                   choices = sort(unique(my_data$cities),decreasing = FALSE),
                                   options = list(`actions-box` = TRUE,`live-search`=TRUE),multiple = T,
                                   selected = unique(my_data$cities)[1:1000]
                                   #selected = c("Taipei") # if we want a preselection
                       ),

                       hr()


      ), # close conditionalPanel


      conditionalPanel(condition = "input.tabselected == 1",

                       h4("Population"),

                       sliderInput(
                         "Selected.population", "Select population",
                         min = 1000000, max = 20000000,
                         value = c(1000000, 4000000)
                       )


      ), # close conditionalPanel


      hr(),
      width = 2

    ), # end of SidebarPanel

    # Main panel for displaying outputs ----
    mainPanel(

      # Output: Tabset w/ plot, summary, and table ----
      tabsetPanel(type = "pills",

                  tabPanel("summary", icon = icon("list"), value = 1,

                           reactableOutput("summary_RT")
                           ),

                  tabPanel("analysis", icon = icon("chart-line"), value = 2,

                           highchartOutput("cities_populations_HC")
                           ),


                  id = "tabselected"
                  ), # close tabsetPanel
      width = 10

    ) # end of mainPanel
  )
)


#------------------------------------------------
#
#
#                  SHINY SERVER
#
#
#------------------------------------------------


server <- function(input, output) {


  #------------------------------------------------

  #                Table 1
  #                Display of Summary table

  #------------------------------------------------


  output$summary_RT <- renderReactable({

    #------------------
    # Get data
    df1 <- my_data

    #------------------
    # Filter

    # Select city
    df1 <- df1 |> filter(cities %in% input$Selected.cities)

    # Select population
    df1 <- df1 |> filter(population >= input$Selected.population[1] & population <= input$Selected.population[2])


    #------------------
    # Transform


    #------------------
    # Table

    reactable(df1)


    })


  #------------------------------------------------

  #                Chart 1
  #                Display of the selected cities populations

  #------------------------------------------------


    output$cities_populations_HC <- renderHighchart({

    #------------------
    # Get data
    df1 <- my_data

    #------------------
    # Filter

    # Select city
    df1 <- df1 |> filter(cities %in% input$Selected.cities)


    #------------------
    # Transform


    #------------------
    # Table

    highchart() |>
      hc_title(text = "Population by cities") |>
      hc_subtitle(text = "in nb of inhabitants") |>
      hc_add_theme(hc_theme_google()) |>

      hc_xAxis(categories = df1$cities) |>

      hc_add_series(name = "Population",
                    color = "mediumseagreen",
                    dataLabels = list(align = "center", enabled = TRUE),
                    data = df1$population) |>

      hc_chart(type = "column")


    })


#------------------------------------------------
} # close server


#------------------------------------------------
#
#
#                  END of SHINY UI and SERVER
#
#
#------------------------------------------------


# Create Shiny app ----
shinyApp(ui, server)
Listening on http://127.0.0.1:7445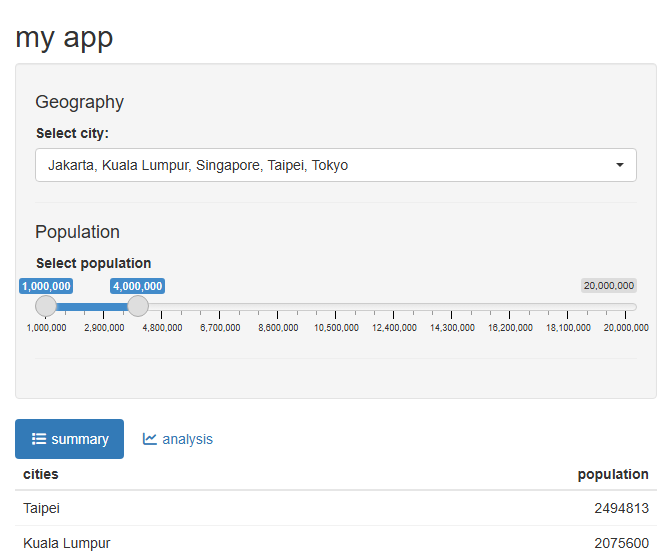
55.3 Text
Now let’s add a text output on the tabPanel “summary”. It will be the sum of the populations of the selected cities.
We will:
create a text object in the server called “
total_cities_populations_TX”.- this object will display the total populations, formatted with some commas to separate the thousands.
place this object next to the summary table, on the left, using the function
fluidRow().
#----------------------
# Upload libraries
#----------------------

# shiny
library(shiny)
library(shinyWidgets)

# ETL
library(tidyverse)

# table
library(reactable)

# charts
library(highcharter)


#----------------------
# Upload data or create datasets
#----------------------

cities <- c("Taipei", "Tokyo", "Singapore", "Kuala Lumpur", "Jakarta")

population <- c(2494813, 14254039, 6110200, 2075600, 10684946)

my_data <- data.frame(cities,
                      population)


#------------------------------------------------
#
#                  Shiny app
#
#------------------------------------------------


#------------------------------------------------
#
#                  SHINY UI
#
#------------------------------------------------


# Define UI ----
ui <- fluidPage(

  # App title ----
  titlePanel("my app"),

  # Sidebar layout with input and output definitions ----
  sidebarLayout(

    # Sidebar panel for inputs ----
    sidebarPanel(

      conditionalPanel(condition = "input.tabselected == 1 || input.tabselected == 2",

                       h4("Geography"),

                       pickerInput("Selected.cities","Select city:",
                                   choices = sort(unique(my_data$cities),decreasing = FALSE),
                                   options = list(`actions-box` = TRUE,`live-search`=TRUE),multiple = T,
                                   selected = unique(my_data$cities)[1:1000]
                                   #selected = c("Taipei") # if we want a preselection
                       ),

                       hr()


      ), # close conditionalPanel


      conditionalPanel(condition = "input.tabselected == 1",

                       h4("Population"),

                       sliderInput(
                         "Selected.population", "Select population",
                         min = 1000000, max = 20000000,
                         value = c(1000000, 4000000)
                       )


      ), # close conditionalPanel


      hr(),
      width = 2

    ), # end of SidebarPanel

    # Main panel for displaying outputs ----
    mainPanel(

      # Output: Tabset w/ plot, summary, and table ----
      tabsetPanel(type = "pills",

                  tabPanel("summary", icon = icon("list"), value = 1,

                           fluidRow(

                             column(3,
                                    h4("Total Populations"),
                                    h5("of the selected cities"),
                                    h2(textOutput("total_cities_populations_TX"))
                                    ),

                             column(4,
                                    reactableOutput("summary_RT")
                                    ),

                             column(5)


                           ) # close fluidRow


                           ),

                  tabPanel("analysis", icon = icon("chart-line"), value = 2,

                           highchartOutput("cities_populations_HC")
                           ),


                  id = "tabselected"
                  ), # close tabsetPanel
      width = 10

    ) # end of mainPanel
  )
)


#------------------------------------------------
#
#
#                  SHINY SERVER
#
#
#------------------------------------------------


server <- function(input, output) {


  #------------------------------------------------

  #                Table 1
  #                Display of Summary table

  #------------------------------------------------


  output$summary_RT <- renderReactable({

    #------------------
    # Get data
    df1 <- my_data

    #------------------
    # Filter

    # Select city
    df1 <- df1 |> filter(cities %in% input$Selected.cities)

    # Select population
    df1 <- df1 |> filter(population >= input$Selected.population[1] & population <= input$Selected.population[2])


    #------------------
    # Transform


    #------------------
    # Table

    reactable(df1)


    })


  #------------------------------------------------

  #                Chart 1
  #                Display of the selected cities populations

  #------------------------------------------------


    output$cities_populations_HC <- renderHighchart({

    #------------------
    # Get data
    df1 <- my_data

    #------------------
    # Filter

    # Select city
    df1 <- df1 |> filter(cities %in% input$Selected.cities)


    #------------------
    # Transform


    #------------------
    # Table

    highchart() |>
      hc_title(text = "Population by cities") |>
      hc_subtitle(text = "in nb of inhabitants") |>
      hc_add_theme(hc_theme_google()) |>

      hc_xAxis(categories = df1$cities) |>

      hc_add_series(name = "Population",
                    color = "mediumseagreen",
                    dataLabels = list(align = "center", enabled = TRUE),
                    data = df1$population) |>

      hc_chart(type = "column")


    })


  #------------------------------------------------

  #                Text 1
  #                Display the sum of the selected cities populations

  #------------------------------------------------


    output$total_cities_populations_TX <- renderText({

    #------------------
    # Get data
    df1 <- my_data

    #------------------
    # Filter

    # Select city
    df1 <- df1 |> filter(cities %in% input$Selected.cities)

    # Select population
    df1 <- df1 |> filter(population >= input$Selected.population[1] & population <= input$Selected.population[2])


    #------------------
    # Transform


    #------------------
    # Text

    value1 <- sum(df1$population)

    formatC(value1, format="d", big.mark=',')


    })


#------------------------------------------------
} # close server


#------------------------------------------------
#
#
#                  END of SHINY UI and SERVER
#
#
#------------------------------------------------


# Create Shiny app ----
shinyApp(ui, server)
Listening on http://127.0.0.1:6170